
Background
Our world finds itself in an unprecedented lock-down to contain the spread of Covid-19. There is definite and sound medical evidence behind the absolute necessity of social distancing. However, the means to impose this on a population have been differently enabled across the world both in the terms of their timing and their stringency. While there have been multiple measures taken by different governments across the world, the results have shown variation in terms of efficacy. This article attempts to understand this variation using two primary data sources. It builds on the prior work highlighted in Emer2gent blog (link, link) by @klausgpaul, @deepak.
The intention is to take the active case based infection_rate calculation and combine it with the stringency measures across countries. From this merged data, specific stringency measures can be looked at for their efficacy and possible variation across countries. Parts of this post can now be accessed at this link for further exploration.
Data
The two data sources used in this assessment
Key Definitions
Infection rate growth (as a proxy of Reproduction Number) over time ‘T’ = The number of active cases added in a given period of time divided by the number of active cases at the start of the period.
Government Response Tracker – Explanatory headings from the data gathered across governments
‘S1_School closing’
‘S2_Workplace closing’
‘S3_Cancel public events’
‘S4_Close public transport’
‘S5_Public information campaigns’
‘S6_Restrictions on internal movement’
‘S7_International travel controls’
‘S8_Fiscal measures’
‘S9_Monetary measures’
‘S10_Emergency investment in health care’
‘S11_Investment in Vaccines’
‘StringencyIndex’
Exploratory Insights
One of the observations from the earlier work was the results of infection growth in Singapore. There was a potential resurgence in the numbers. The first exploration was to check if that can be explained by the stringency measures.
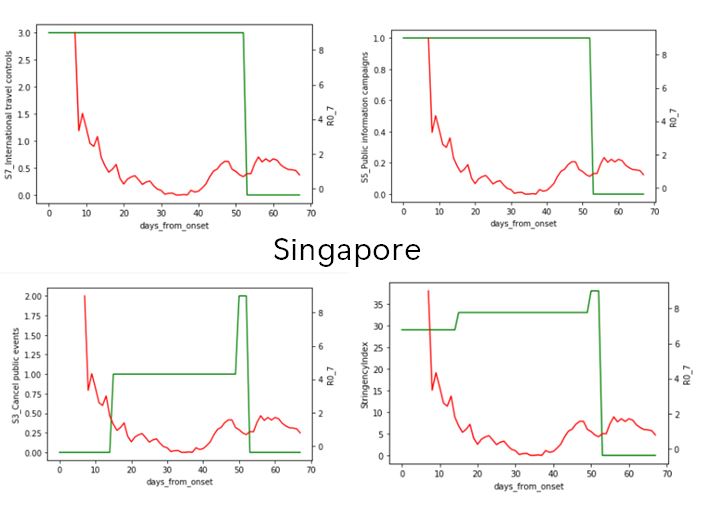
Fig. 1 – The key stringency measures which correlate with the slight increase in reproduction number towards the end of the curve.
The red line represents the Rate of Infection (with a 7 day lag) and green line shows the stringency measure.
This plot clearly shows the response rate of infection is a just few days. Public event cancellation shows an interesting fluctuation which was reflected at both the downward slope at its increase around day 50, and again an upward trend as it was brought down to zero.
Interestingly, some of the other measures have a lower impact and almost no correlation with the infection growth rate. The next step was to check if measures have a consistency across countries. For this, correlation is used as a means of initial exploration. NOTE that for time varying data, correlation is not an absolute measure of confidence, so additional visualization are also created part of which are published as part of this writing. Moreover, further work on this is in progress.
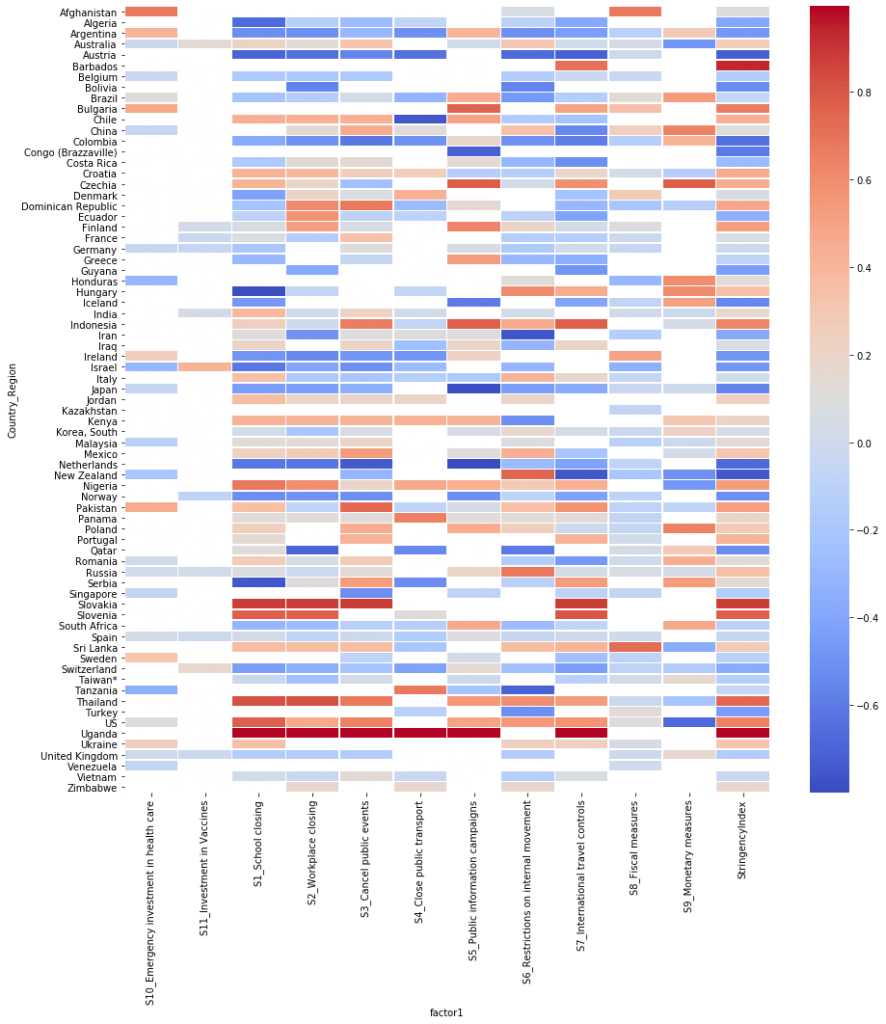
FIg. 2 – Heatmap of correlation between stringency measure and Rate of infection growth. Deep Red indicates a positive correlation, blue indicates negative.
Key takeaways from above plots
- Slight majority of countries have had a neutral or negative correlation, which implies infection rates have reduced with increased stringency.
- However, there are few countries where the rates have gone up.
- This could imply factors not accounted in this data, example granularity of data (county or state wide measures not reflecting in the total country wide stringency).
- It could also imply a difference between the ground reality of imposed lock-down and the understanding from source.
- There are few countries (example US, Austria) which show opposite response – these are selected for a further deep dive.
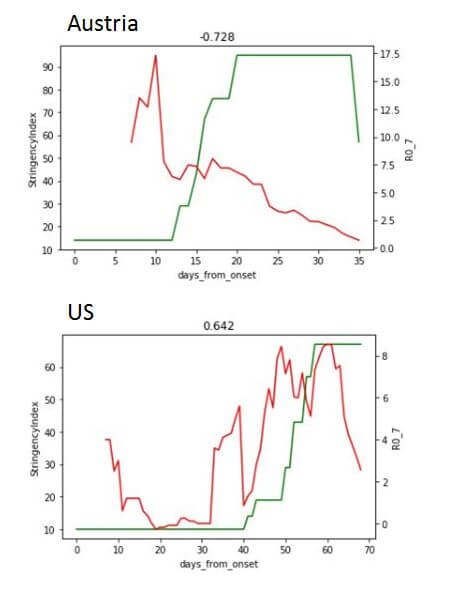
Fig. 3 – Comparison of positive and negative correlation indices. The numbers on top of image show the raw correlation value.
As can be seen from Fig. 3, a lagging response could result in lower efficacy or delayed efficacy as in the case of US. And while a positive correlation can be misleading in its raw consumption, it can provide guidance on more meaningful comparisons.
Going back to further takeaways from fig. 2, for a particular country this could be used to understand how to ease the lock-down. As an example, see below plot for Italy.
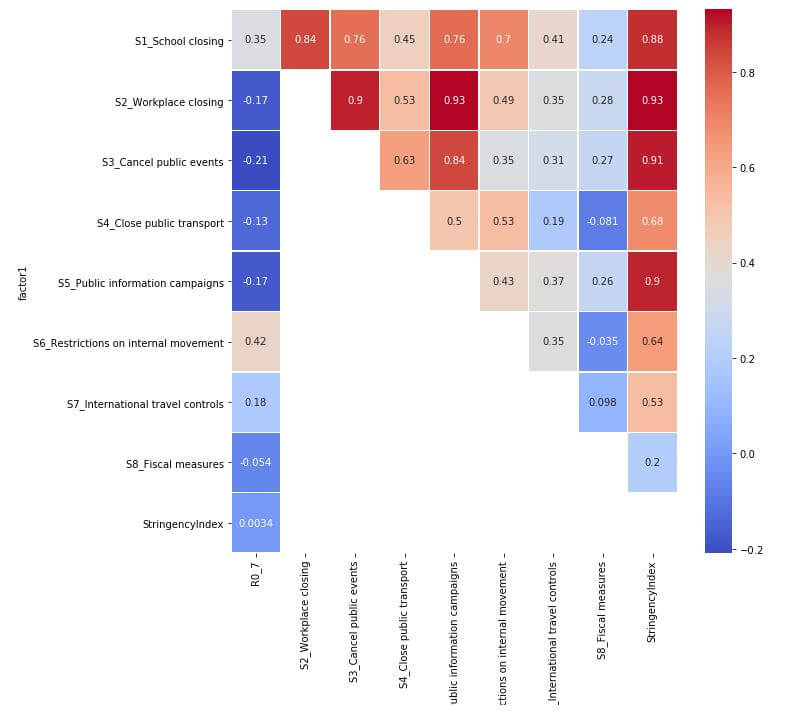
Fig. 4 – Correlation heat map for Italy
It is clear from the plot above that public transport had a smaller role relative to restrictions in internal movement and school closing.
The intent of this post is to foster discussion and come up with better means of analyzing this information. So, please reach out with your thoughts.
Disclaimer
The author is not an epidemiology or policy expert. The article is intended to guide towards better assessment and is a work in progress.
Citations
- Hale, Thomas, Sam Webster, Anna Petherick, Toby Phillips, and Beatriz Kira (2020). Oxford COVID-19 Government Response Tracker, Blavatnik School of Government. Data use policy: Creative Commons Attribution CC BY standard.