
Purpose
Artificial Intelligence (AI) is getting increasingly popular throughout the last decade. Machine Learning (ML) approaches seem adequately positioned to make predictions and automated suggestions based on large amounts of data. Therefore, the need to build robust & consistent data pipelines has increased. AI doesn’t come alone, the new approaches now couples data with AI to ensure high quality AI applications.
The goal of the Emergent Alliance project Regional Risk-Pulse Index: forecasting and simulation is to quantify and track the social and economic effects of Covid-19. As such, it is a must to build an end to end data & AI pipeline that can bring data regularly to a centralised data store based on jobs that run in the background. Based on that description of a pipeline, the data collection stage will be integrated directly with the ML pipeline.
To summarise, this blog presents the Data pipelines that were built as part from the Regional Risk-Pulse Index project. These Data pipelines automate the ingestion, storage and transformation of data, which are going to be used later on by the Dashboards and ML models that are built in IBM Cloud Pak for Data and Cognos Analytics.
Methodology/Architecture
Data collection from different data sources (structured/semi-unstructured/unstructured) creates a need for advanced data acquisition, management, and flexible storage (eg. NoSQL Databases).
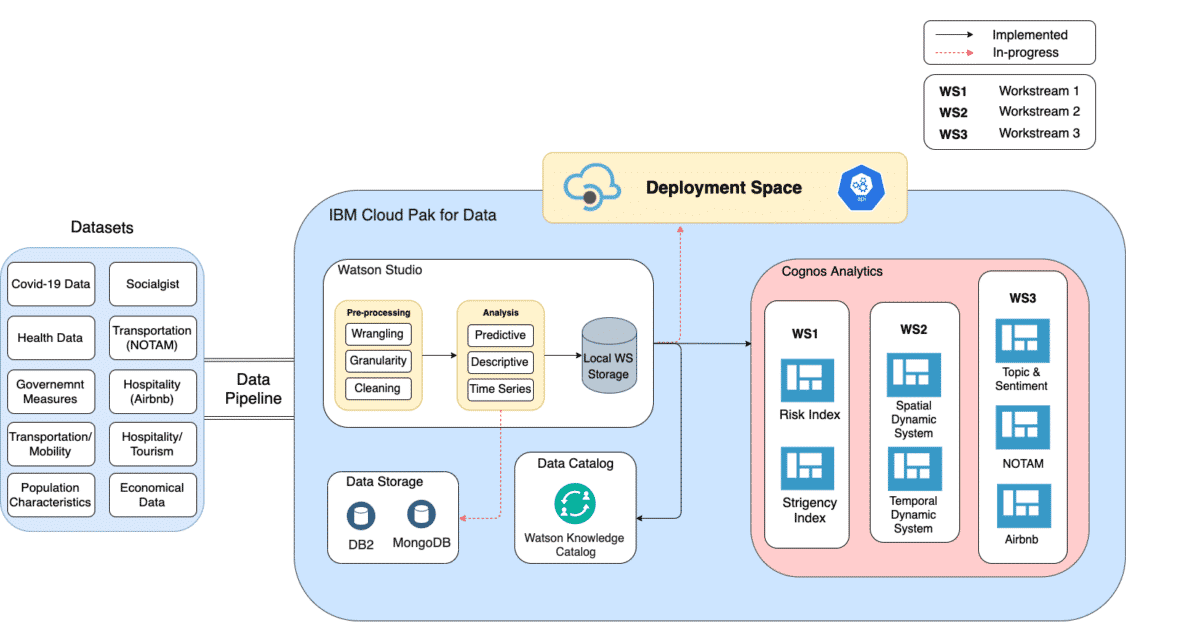
Figure 1. shows the high-level architecture for the Regional Risk-Pulse Index and what data is going to be included in the analytics part. Based on the popular IBM AI Ladder (Collect, Organize, Analyze, and Infuse), Cloud Pak for Data as a platform contains the necessary components (Watson Machine Learning, Watson Studio, Cognos Dashboards and Watson Knowledge Catalog) to build robust data pipelines. The main idea is to unify the data pipeline as showed in Figure 1, while having different Data Science workstreams that can all consume that data in different ways. The collected data is being stored in a schema upon agreement with Data Scientists to ensure the ease of use.
Data Pipeline
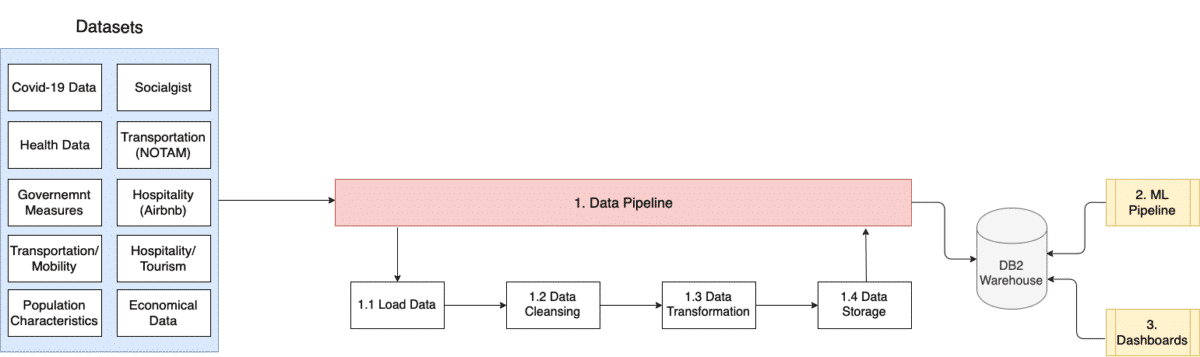
Figure 2. depicts the Data Pipeline that is built for the EA. As most of our data sources are RESTful APIs or CSV files, the typical ETL processes fit perfectly the needs.
- Load Data: In this stage, data is being loaded in a staging area that we use to do the data wrangling before pushing it to the centralised data storage.
- Data Cleansing: Data cleansing is crucial in the Data & AI pipelines. Bad quality data is everywhere, therefore the process of making this data clean enough is essential for successful AI implementations. In this stage, we check the consistency of the loaded data, remove any dirty data, and standardise the data formats, such as the date.
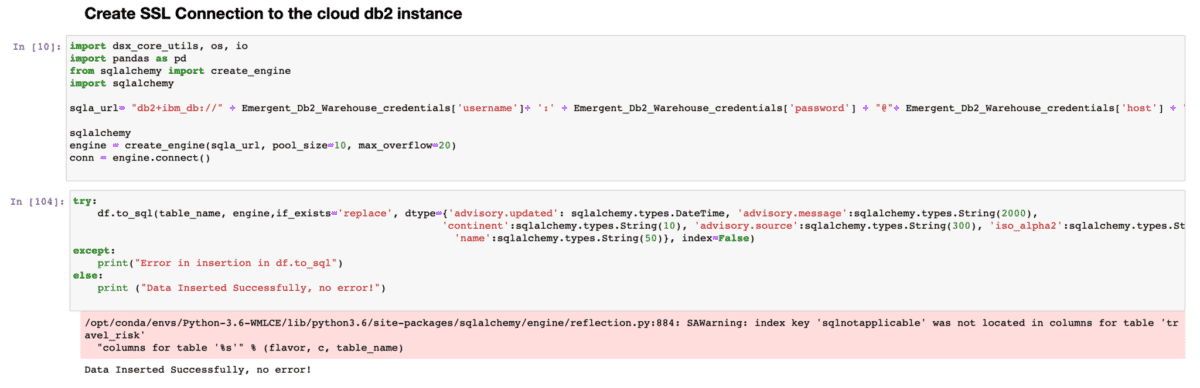
- Data Transformation: Data transformation is the process of transforming the dataset from one format to another. In the Emergent Alliance case, we are collecting the data from different data sources, loading them into Pandas dataframes for the purposes of cleansing, consolidating, merging and transforming data into structured tables and then push them to the DB2 Warehouse instance.
- Data Storage: The final stage at any data pipeline is to store the processed data to a persistent storage layer and make it available for others. After going through the prior stages in the pipeline, all data is being pushed to DB2 Warehouse.
- ML Pipeline and Dashboards can then access data from DB2 for visualising the data or beginning the AI pipeline. The ETL pipeline is scheduled to run on a regular basis to bring new data to the centralised data storage, and hence ML pipeline and Dashboards are also being updated regularly.
The technical implementation details will be described later in this article.
Technical Part/Implementation
Data Sources
Once all the data sources have been gathered, they must be prioritised accordingly. The reasoning behind this is because not all the data sources are of the same nature, as a result of this the end-to-end pipeline needs to accommodate this – for example the data transformation. Some of the categories in which we used to understand the data are shown in the diagram below. Highest priority data sources were assigned to the ones that were dynamic. Dynamic data sources are the ones in which have to be transformed upon being brought into the CP4D environment.
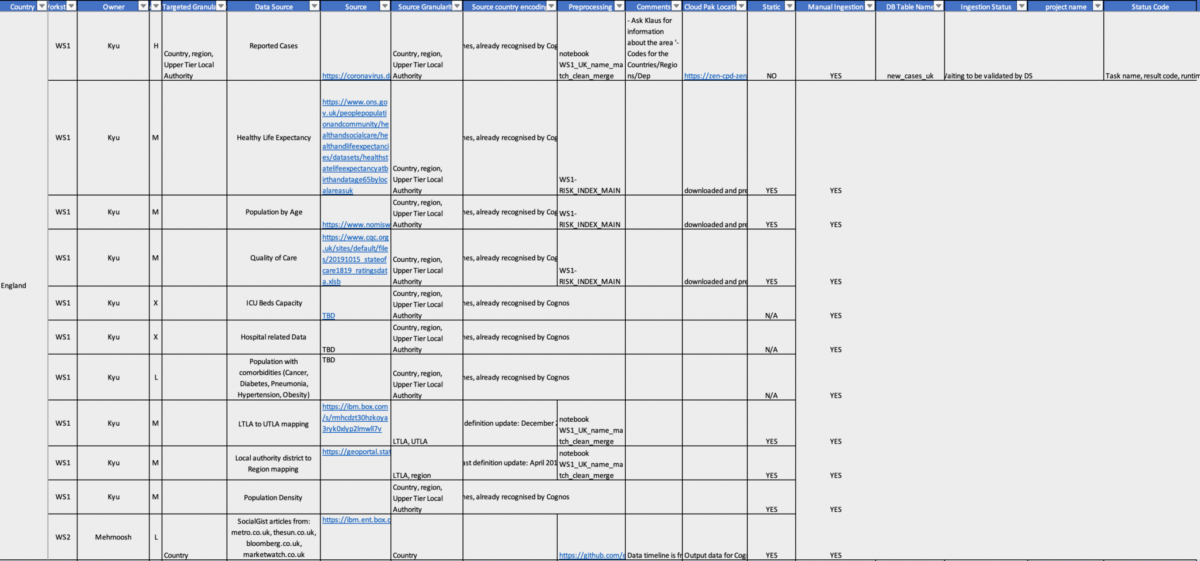
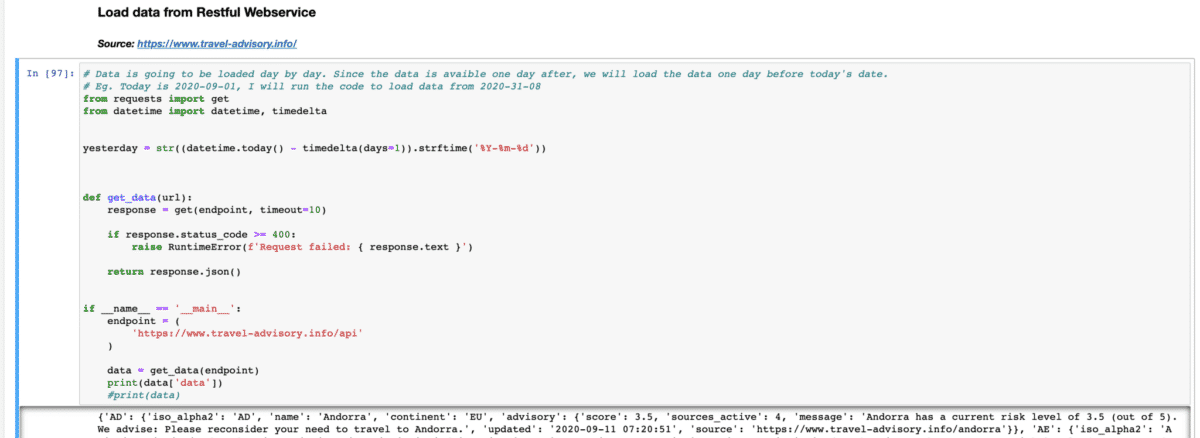
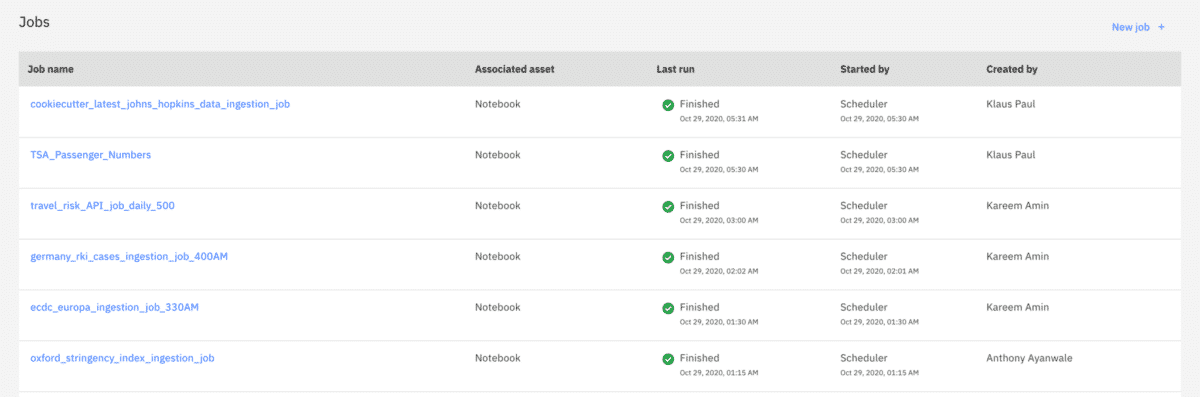
Jupyter Notebook and Scheduler
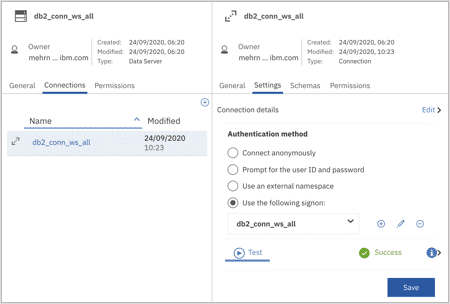
We created a Jupyter notebook where we ingest the data using the data sources spreadsheet in the image above. Once that data has been ingested, any transformation that is required is performed in the notebook and the then data is pushed to DB2. Once that is done, the scheduler is set in CP4D and the Jupyter script is ran regularly to update the table and is pushed to CP4D.
Cognos
Once the data is in DB2, you can connect to Cognos Analytics (CA). Cognos allows the user to visualize, analyze and share actionable insights about your data. CA is shown below.
Conclusion
To summarise, the importance of the end to end pipeline to the EA is evident. The data pipeline is a necessary step because as data ingestion, transformation and storage are automated it allows efforts and time in the EA to be diverted elsewhere. It has made the data maintenance easier as now there is a centralised database where all the data lies, so if there is an issue with a particular table, it can be easily identified and resolved. As well as this, it has allowed for Data Scientists in the EA to experience added improvements to speed, reliability and performance of tasks. An added positive is that this supplements the dashboard use as now the dashboard can directly connect to the database and be updated regularly.
Authors
Anthony Ayanwale is a Data Scientist within IBM’s Cloud Pak Acceleration team, where he specializes in Data Science, Analytics platforms, and Machine Learning solutions.
Kareem Amin is a Data Engineer within Data Science Elite team, where he specializes in Data Engineering, Architecture, Data Schemas and End-to-end Data & AI Pipelines.
We are a team of data scientists from IBM’s Data Science & AI Elite Team, IBM’s Cloud Pak Acceleration Team, and Rolls-Royce’s R2 Data Labs working on Regional Risk-Pulse Index: forecasting and simulation within Emergent Alliance. Have a look at our challenge statement!