Motivation
The dynamics of the Covid-19 outbreak and the effects of ensuing countermeasures introduced by governments across the world have brought the networked nature of the world and the emergent complex response into sharp focus. Governments and businesses are recognizing the inherent potential in data to understand current events and to fathom the scope and shape of recovery [1].
We as participating data scientists in the Emergent Alliance would like to quantitatively analyze the effect of countermeasures (principally Non-Pharmaceutical Interventions or NPI’s) on socioeconomic indicators such as mobility, energy use.
In this blog, we present a causal analysis of lockdown measures on mobility (of individuals and goods) and energy use in Germany. We believe that such an analysis is in principle transferable to other countries as well (the causal diagrams encoding our beliefs might change a bit of course). For this analysis, we use DoWhy, a Python library implementing Judea Pearl’s do-calculus for causal inference that provides a unified interface for causal inference methods.
In our opinion, such an analysis serves the following purposes
- Policymakers and analysts can use the results to understand the magnitude of effects due to NPI’s. Even more so than the exact results, we consider the analytical underpinnings of our approach as something of interest for estimating and planning purposes
- With public consciousness gradually focussing on sustainable recovery, we intend our analysis to be applicable here as well, for instance, quantifying the effect of climate-neutral measures on economic indicators.
Data
To identify and track in-time policies to prevent the spread of the virus, we use the Oxford COVID-19 Government Response Tracker. This repository collects the measures taken by governments of various countries to curb the spread of COVID-19 and classifies them into various indicators [2].
For our individual (personal) mobility indicator, we use the transit mobility trend that is reported by Apple [3]. As Berlin is the most populous city in Germany, we use Berlin’s mobility trend data for our analysis. Berlin has a well-connected public transport system that is actively used by commuters. So transit mobility trend is a good indicator of the impact of lockdown measures.
We account for two weather indicators in our model. First, to account for the state of the atmosphere each day, we consider air temperature for Berlin [4]. We believe that temperature data is a good indicator of the overall weather conditions, which motivates many people’s decision to do outdoor activities. Second, we also use seasonal indicators (Winter, Spring, etc). With this, we aim to account for seasonal variations in people’s mobility (vacations are more likely in Spring and Summer, for instance).
We consider two proxies for economic activity at a daily frequency level. The first one is electric load data on Germany’s grid, as provided in Entsoe, a transparency platform that collects and distributes energy data for Europe [5]. The use of electricity data to proxy economic activity has already been tested in the literature, such as in [6]. The other economic proxy is the movement of heavy trucks on German highways, which is provided by Statistisches Bundesamt (Destatis) [7].
Hypothesis
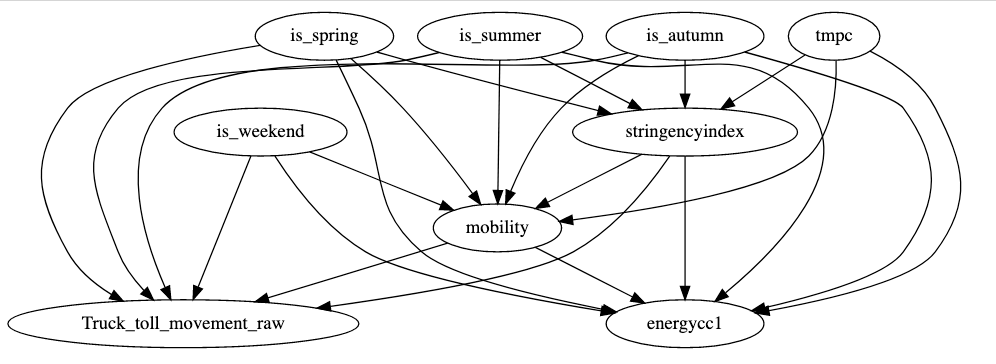
The common tactic of most of the measures to curb the spread of the virus is to reduce the mobility of people. Consequently, mobility plays a central role in our modelling efforts. However, there can be many other factors determining how much people move around, such as weather or the day of the week. To formalise our understanding of causes and effects in our problem, we define a Model of the World. A Model of the World is the starting point for any causal analysis, and it encodes knowledge or beliefs describing causes and effects.
Our model of the world is based on the following links:
- Electricity consumption, truck movement and mobility are affected by the weather. Air temperature and seasons are used as proxies for the latter.
- Electricity consumption, truck movement and mobility are affected by lockdown measures, as compiled in the Oxford COVID-19 Government Response Tracker. Stringency is used as a proxy for lockdown.
- Electricity consumption, truck movement and mobility follow a weekly pattern (people work mostly on weekdays for example). A flag is_weekend encodes this information.
- The raw time-series nature of the data is flattened out to individual non-sequential records by including additional seasonal indicator columns such as is_weekend, is_winter, is_spring, is_summer, is_autumn.
- Electricity consumption, truck movement and mobility on a day is independent of the day before.
We assume that weather conditions influence the spread of the virus because people tend to stay more indoors in winter, which causes more infections. A higher number of cases cause more severe lockdown measures. As the infection numbers are recorded at times with a lag, we simplify the following
Weather —> Case numbers —-> Lockdown
to
Weather —> Lockdown
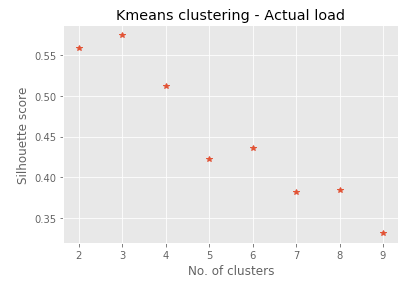
We reduce the dimension of hourly electricity consumption data by identifying usage clusters. K-means is used to cluster the electricity consumption data to identify different load profiles. We need to specify the number of clusters to be identified using K-means clustering. The silhouette value is used in helping us identify the ideal number of clusters in the data. Silhouette value is a measure of how similar an object is to its own cluster compared to other clusters [8]. The silhouette value was the highest when 3 clusters were used. This value of 3 clusters also corresponds roughly to the three typical load profiles that we observe daily: peak load during rush hour in the morning and evening, steady load in the afternoon, and reduced load at night. We then transform the electricity consumption data into cluster-distance space where each variable denotes the distance to the respective cluster centre. We use one of the cluster-distance values in our analysis.

Note here that the set of hypotheses presented above is not intended to be complete or exact, but an attempt to use the language of causal modelling to derive insights. Readers are invited to point out any critique or observations.
We can summarise the hypothesis in a causal graph, which looks like the image below:

Methodology and Results
The documents of the DoWhy package [9] describe a causal analysis research process based on four steps: (i) model of a causal problem, (ii) identification of a target estimand, (iii) estimation of a causal effect based on the target estimand, and (iv) refutation of the estimate. We adopt this methodology for our analysis.
1. Model
In this first step, we define the problem as a causal graphical model. The hypothesis stated above is the graphical model used in our causal inference. The treatment variable (lockdown) and the outcome variable (electricity consumption) are defined while creating the model.
2. Identify
Use the created causal model to identify the causal effect of the treatment on the outcome. The DoWhy library uses graph based criteria and do-calculus to identify the causal effect.
3. Estimate
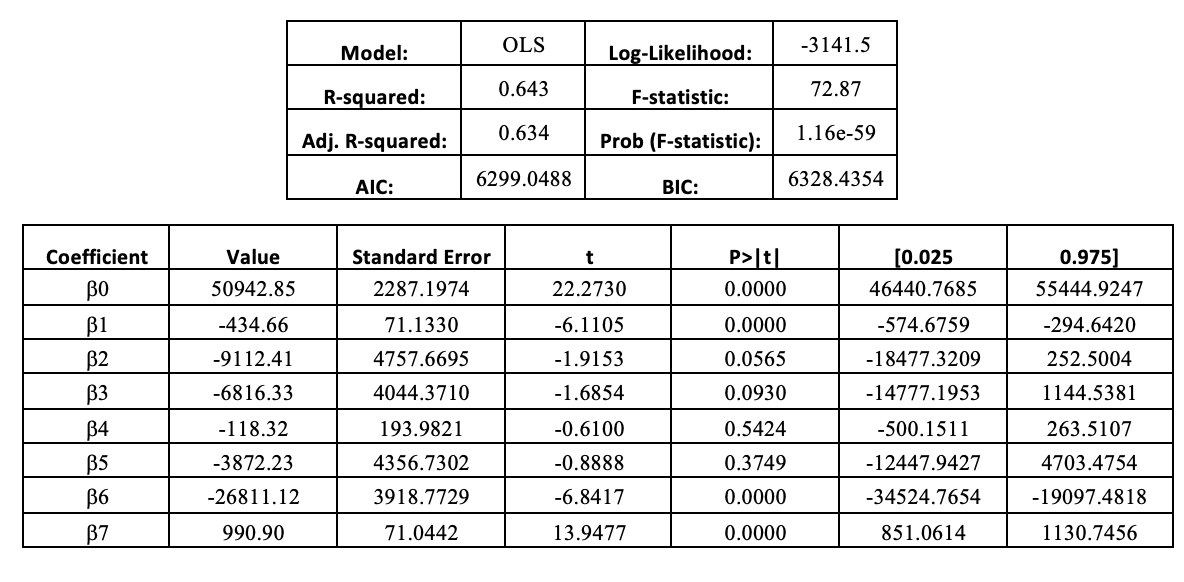
The causal effect is estimated using the estimand identified in the previous step and one of the supported estimation methods. In our case, we use a linear regression model and we get the following function to estimate electricity consumption (estimator):

Where the effect on energy consumption of one more point in the stringency index is determined by

The linear regression model details are displayed in the tables below:

4. Refute the estimate
Once we estimate the causal effect, we use some of the refutation methods to test the validity of our assumptions mentioned in our causal model. This allows us to test the robustness of our specification to changes in our variables. In our analysis we use the following refutation methods:
- Placebo Treatment:
What happens to the estimated causal effect when we replace the true treatment variable with an independent random variable? (Hint: the effect should go to zero)
In our case adding a placebo treatment brought the estimate of the new effect to zero as expected. - Add Random Common Cause:
Does the estimation method change its estimate after we add an independent random variable as a common cause to the dataset? (Hint: It should not)As expected, adding a random common cause didn’t change the estimate of the new effect in the current analysis.
The results of the refutation methods confirm the causal effect of lockdown measures on economic activity. We use the DoWhy method to run counterfactual estimates and find out what the electricity consumption would have been had there been no lockdowns and another estimate of the electricity consumption for maximum lockdown measures. Using these two estimates we find the percentage impact of lockdown measures on electricity consumption. The estimates are based on the data generated between January and October 2020. We estimate that the current lockdown could have caused up to 55% decrease in electricity consumption for time periods roughly corresponding to “peak commuter hours” on daily basis. A counterfactual estimation shows that a complete lockdown could have up to 69% effect on electricity consumption for the same. For more details, please refer to the Jupyter notebook available on GitHub.
Key Takeaways
In this blog, we have presented a way of estimating the causal impact of lockdowns on certain socioeconomic indicators, primarily mobility and energy use. Our analysis shows that lockdown measures do have a quantifiable causal effect on economic activity, as measured by electricity consumption in Germany. In the event of a total lockdown, this effect could be as high as a 69% reduction in electricity consumption on certain daily time periods.
Disclaimer:
This information is intended for educational and research use. The authors do not recommend generalizing the results and conclude decision-making on these sources alone.
Authors:
Shri Nishanth Rajendran is an AI Developer in R2 Data Labs, Rolls Royce Deutschland, Germany, specialising in analytics for equipment health management and intelligent assistants that help humans in making data-driven decisions
Deepak Shankar Srinivasan is an AI Developer in R2 Data Labs, Rolls Royce Deutschland, Germany, specialising in data science applications for equipment health management and deep domain-specific smart assistants
Álvaro Corrales Cano is a Data Scientist at IBM Cloud & Cognitive Software. With a background in Economics, Álvaro specialises in a wide array Econometric techniques, including causal inference, regression, discrete choice models, time series and duration analysis.
The authors would like to thank Kunal Sawarkar, Ainesh Pandey, Andre Violante, Ehud Karavani, Sarah Boufelja-Yacoubi and Klaus Paul for their valuable feedback, as well as Rolls-Royce plc. and IBM for supporting this work.
We are a team of data scientists from IBM’s Data Science & AI Elite Team, IBM’s Cloud Pak Acceleration Team, and Rolls-Royce’s R2 Data Labs working on Regional Risk-Pulse Index: forecasting and simulation within Emergent Alliance. Have a look at our challenge statement!
References
[1] How COVID-19 is disrupting data analytics strategies https://mitsloan.mit.edu/ideas-made-to-matter/how-covid-19-disrupting-data-analytics-strategies
[2] Oxford COVID-19 Government Response Tracker https://www.bsg.ox.ac.uk/research/research-projects/coronavirus-government-response-tracker
[3] Apple Mobility Trend Report https://covid19.apple.com/mobility
[4] Weather data: https://mesonet.agron.iastate.edu/ASOS/
[5] Electricity consumption – Actual load data – https://transparency.entsoe.eu/load-domain/r2/totalLoadR2/show
[6] Arora, V. and J. Lieskovsky, Electricity Use as an Indicator of U.S. Economic Activity (2014). Working paper, U.S. Energy Information Administration. https://www.eia.gov/workingpapers/pdf/electricity_indicator.pdf

