
As part of our blog series on Regional Risk Index and Epidemiology modelling, here are two blogs on the Effective Reproduction Number.
The Effective Reproduction number will be covered in two blogs:
- This first blog describing the calculation methodology for Germany.
- The second blog will cover the generalization of the previous methodology globally and the reproduction number forecasting.
Objective
To be able to understand and later foresee government decisions on lockdown measures, we need to look at the same metrics as governments do. Among others as active cases or intensive care units, this is also the (effective) reproduction number, e.g. as can be seen in the currently applied “Corona traffic light” for Berlin [1]. Also, the calculated effective reproduction number can be used as an input for the epidemiological model and provides a more realistic value compared to a model-based assumption.
Germany Specific Calculation
In Germany these numbers are calculated and published by the Robert Koch Institute (RKI). Unfortunately until end of May, they did not share their calculation code, but a description of the calculation methodology and the resulting numbers are available in their reports [2].
So, in order to calculate these numbers not only for Germany, but for other countries as well, we had to code this procedure on our own, validate our numbers with those from RKI and apply then the methodology globally. The goal is to get a reliable overview of the reproduction number in different regions worldwide.
Data Sources
Let’s have a look at the data sources and discuss what is so special about the data provided by RKI. The data, which is published for different regional granularity, includes not only case numbers but also next to the reporting date, the so-called symptoms onset date. This date is acquired by asking the patients, who had symptoms and conducted a Covid-19 test for the date when the symptoms started. This date enables us to have a more realistic view on the disease spread than the reporting date, as there is always a time delay between symptoms onset and reporting date. So especially compared to data sources for global case numbers, e.g. from Johns Hopkins University [3] the data provided by RKI offers more insights. This described reporting delay can be seen also in the RKI dashboard [4].
![A screenshot taken from the RKI dashboard [4] on 2020/07/30 showing the number of new cases per day. Translation: Meldedatum – reporting date, Erkrankungsbeginn – symptoms onset date](https://emergentalliance.org/wp-content/uploads/2021/01/Screenshot_RKI_Dashboard-1200x546-1.png)
Screenshot taken from the RKI dashboard [4] on 2020/07/30 showing the number of new cases per day. Translation: Meldedatum – reporting date, Erkrankungsbeginn – symptoms onset date
Calculation Procedure
The calculation of the effective reproduction number consists of multiple steps:
1. Imputation
At first, the datapoints with missing symptoms-onset date have to be imputed. Therefore, for all datapoints for which we have the reporting and the symptoms onset date the reporting delay is calculated. Then a Weibull distribution is fitted for the reporting delay. This distribution is then applied to the datapoints with missing symptoms onset date to assign them a certain reporting delay and hereby imputing the symptoms onset date. The so constructed Weibull Distribution for overall Germany can be seen here:
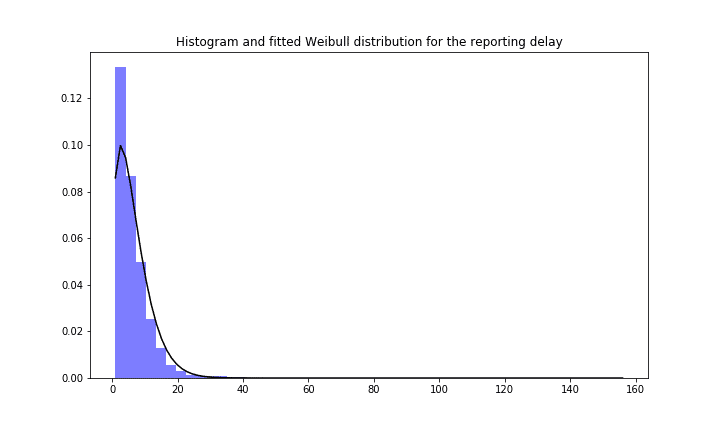
Reporting delay and fitted Weibull distribution for Germany Covid 19 case numbers.
One gets an even more granular approach when constructing the Weibull distribution with the calendar week as a covariate, according to [6] and using these distributions then for the steps of imputation and nowcasting. For Germany these distributions look like:
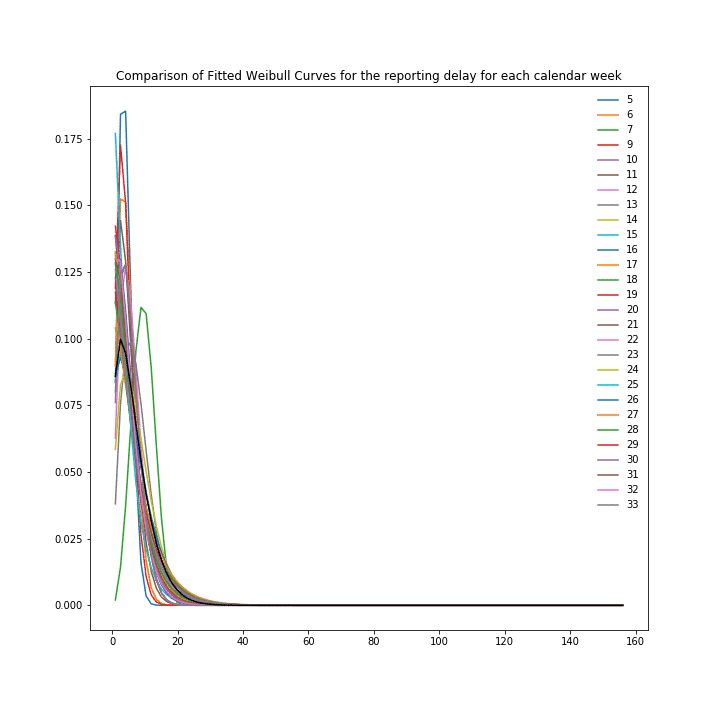
Reporting delay and fitted Weibull distribution for Germany Covid 19 case numbers with the calendar week as a covariate.
2. Nowcasting
The same distributions are then also used to adapt the case numbers to account for the cases which according to the delay distribution will be reported in the future with symptoms onset date until today. The python routine, which was used, originates from [7].
In the following plot the effects of Imputation and Nowcasting based on the ~65% of cases with given symptoms onset date for Germany can be seen. The plot shows number of new cases over symptoms onset date.
Number of daily new cases with given symptoms onset date, Imputation and Nowcasting applied to the cases with only the reporting date given.
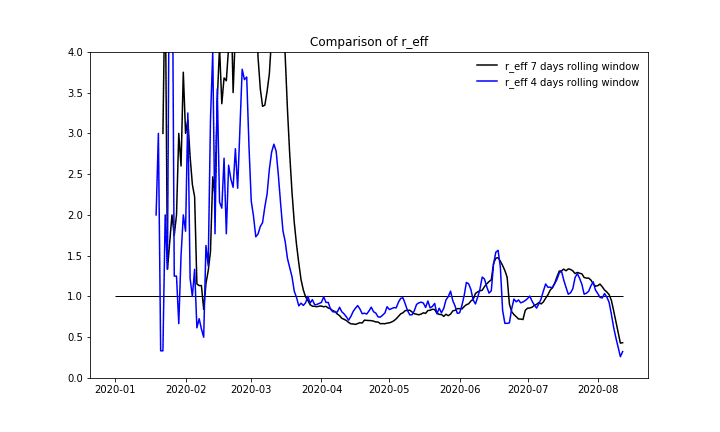
3.Rolling Window Ratio
The calculation of the effective reproduction number itself is performed as a summation of case numbers for a specific amount of days and subsequently calculating the ratio between two sums. The proper selection of this series of intervals requires epidemiological domain knowledge and is fundamental for the sensitivity of the calculated data. RKI started with a four days interval in April but used seven days later on. The discrepancy between these calculation procedures can be seen in this document [8] and in the following plot:
Number of daily new cases with given symptoms onset date, Imputation and Nowcasting applied to the cases with only the reporting date given.
Comparison with official published numbers
As mentioned earlier RKI did not publish their code but did publish the numbers for nowcasting case numbers and the effective reproduction number itself. Therefore, we can compare and validate our calculation procedure.
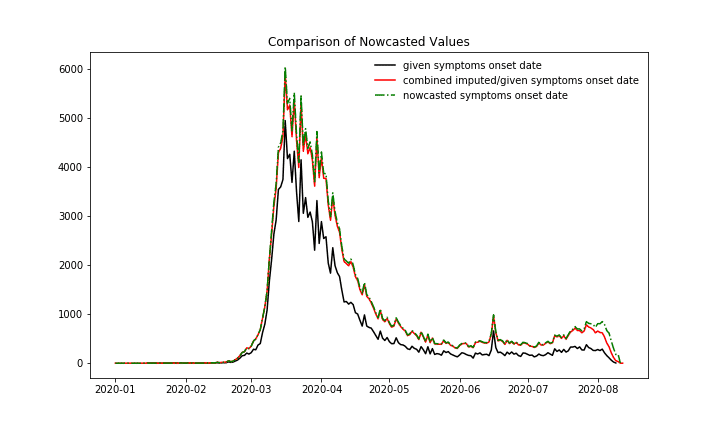
At first, we compare the nowcasting numbers. In the following plot with new case numbers over symptoms onset date can be seen:
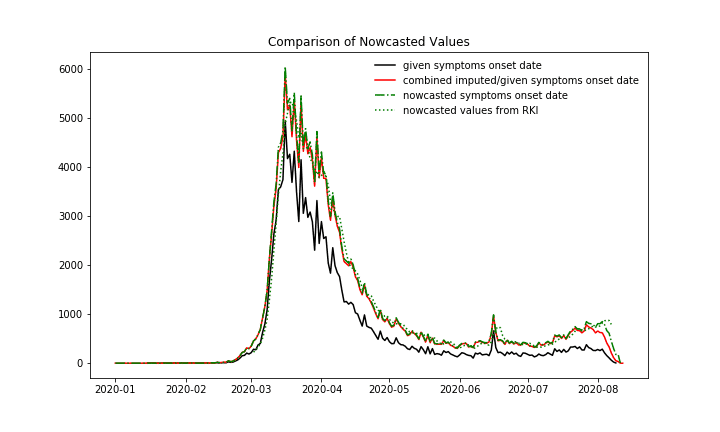
New cases over symptoms onset date. 1. Black: All cases, for which the symptoms onset date is provided in the data ~65%, 2. Red: The cases with given symptoms onset date plus the imputed case numbers, which means the imputation is only applied to these cases with missing symptoms onset date, 3. Green dashed: Nowcasted case numbers, so the imputed case numbers plus the case numbers which are expected to be reported in the future with a symptom’s onset date until today, 4. Green dots: Nowcasted case numbers, published by RKI
We also want to compare the results of the calculation procedure and take a look at the reproduction number itself. For overall Germany we can see a good fit between the values published by RKI and our results.
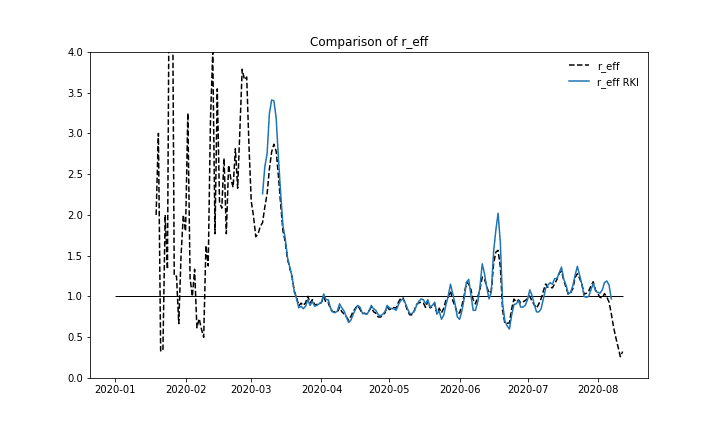
Effective reproduction number over time, comparing our calculation with numbers published by RKI.
The code for the described calculation can be found in our GitHub repository.
We are a team of data scientists from IBM’s Data Science & AI Elite Team, IBM’s Cloud Pak Acceleration Team, and Rolls-Royce’s R2 Data Labs working on Regional Risk-Pulse Index: forecasting and simulation within Emergent Alliance. Have a look at our challenge statement!
Author: Astrid Walle is an AI Dev Specialist at R2 Data Labs at Rolls Royce Deutschland Ltd
The work was done in collaboration with Kyuhwa Lee and Sarah Boufelja, who are members of the IBM Data Science & AI Elite Team, as well with Klaus Paul, head of Berlin AI Hub at R2 Data Labs .
Special thanks to Erika Agostinelli and Mehrnoosh Vahdat.
Disclaimer: This information can be used for educational and research use. Please note that this analysis is made on a subset of available data. The authors do not recommend generalising the results and conclude decision-making on these sources only.
Works Cited
| 1 | Tagesspiegel, “Berlin schaltet auf Rot-Grün-Grün,” 2020. [Online]. Available: https://www.tagesspiegel.de/berlin/erste-warnung-der-corona-ampeln-berlin-schaltet-auf-rot-gruen-gruen/25859400.html. [Accessed 08 2020]. |
| 2 | M. an der Heiden and O. Hamouda, “Schätzung der aktuellen Entwicklung der SARS-CoV-2- Epidemie in Deutschland – Nowcasting,” Epidemiologisches Bulletin, vol. 17, pp. 10-15, 2020. |
| 3 | COVID-19 Data Repository by the Center University, “JHU CSSE COVID-19 Data,” [Online]. Available: https://github.com/CSSEGISandData/COVID-19. |
| 4 | Esri Deutschland GmbH, “Robert Koch-Institut: COVID-19-Dashboard,” 2020. [Online]. Available: https://experience.arcgis.com/experience/478220a4c454480e823b17327b2bf1d4. [Accessed 08 2020]. |
| 5 | NPGEO Corona, “RKI COVID19,” 2020. [Online]. Available: https://npgeo-corona-npgeo-de.hub.arcgis.com/datasets/dd4580c810204019a7b8eb3e0b329dd6_0. [Accessed 08 2020]. |
| 6 | S. Gloeckner, G. Krause and M. Hoehle, “Now-casting the COVID-19 epidemic: The use case of Japan, March 2020,” medRxiv, vol. 03, no. 18, 2020. |
| 7 | K. Systrom, T. Vladek and M. Krieger, “rt.live,” Github repository, no. https://github.com/rtcovidlive/covid-model, 2020. |
| 8 | Robert-Koch-Institut, Erläuterung der Schätzung der zeitlich variierenden Reproduktionszahl R, 2020. |