
The Covid-19 pandemic has affected our lives in ways that weren’t imaginable a few months ago. While necessary to curb the spread of the virus, lockdown measures around the world have forced many businesses to stop operating, some of them permanently. It is apparent that these measures and the resulting economic fallout are here to stay for some time, and we are witnessing the onset of an unprecedented economic crisis – the second in over a decade.
Policymakers, business leaders and the greater public are in dire need of purposeful insights that will help them answer the primary question – How do the lockdowns and other countermeasures affect the economy? This blog attempts to answer the question. Not surprisingly, one needs to comprehend and use the global economic network to even make such an attempt!
The building block of our approach is Leontief’s Input-Output model. This economic model was formalised by Wassily Leontief in 1951 [1] and has become a common tool for economists to understand economic networks (see Carvalho and Tahbaz-Salehi (2018) [2], for instance). At its core, the model is based on the idea that sectors in an economy are interconnected through input-output linkages. In other words, part of what one sector produces is used as an input by other sectors. We complement the Leontief model, static by nature, with a dynamical system approach. This allows us to model how the economy would be affected by shocks to different sectors (such as forced shutdowns) and what the recovery path may look like (once the shocks disappear).
The code and data for this analysis can be accessed on Github.
Constructing our Input-Output Model
Input-output tables are a network representation of how goods flow in an economy. What is produced by a company can be consumed as an intermediate input by other companies (in the same or a different sector), by the government, by final consumers or exported. In an input-output table, these relations are represented in a matrix form, with rows representing the sectors that produce a good, and the columns representing the sectors (or final consumers) that use that good. For example, the cell at the intersection between the Mining sector and the Machinery sector would give us how much of the production by the mining sector is used as an input by the Machinery sector. You can see an abstraction of this model in the image below [3].
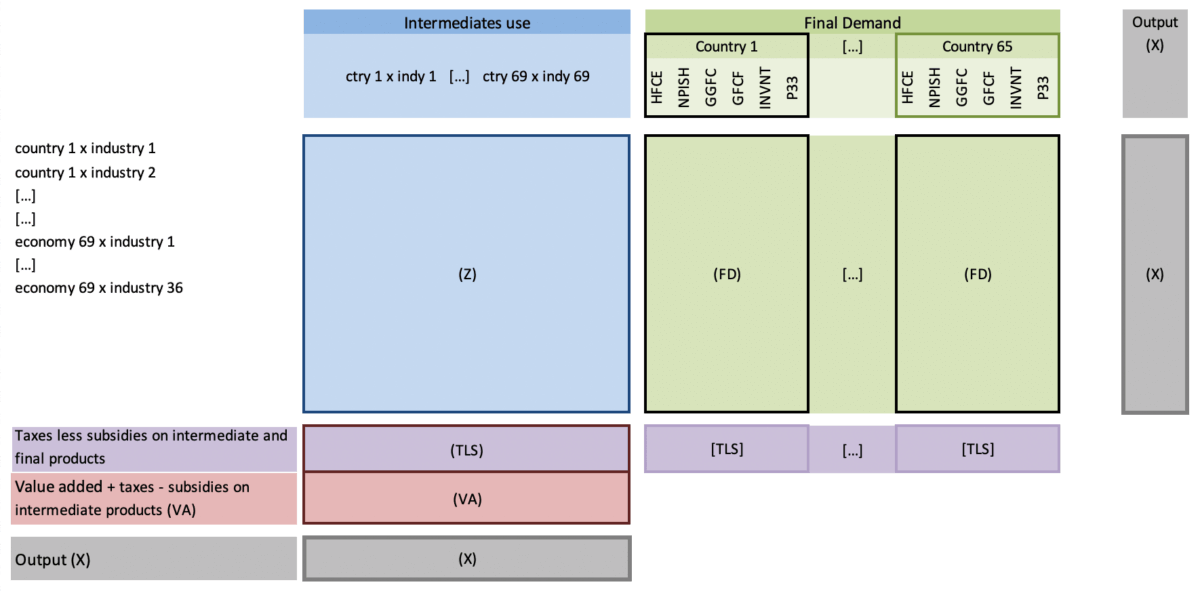
It is common for statistical offices around the world to produce input-output tables. For our purposes, we use the tables corresponding to the year 2015, published by the OECD in 2018 [4], which collate information for 36 economic sectors in 69 economies. Unfortunately, just like almost all datasets, these tables don’t show exactly what we need, but require some engineering. In particular, what we see in these tables are flows of goods (or, more precisely, their monetary value). However, to conduct “what-if” simulations (the goal of this analysis), what we need is a generalisation of these flows; that is, a coefficient matrix that maps a production function between sectors. Think of the output y of sector i as a weighted average of some inputs z from other n sectors:
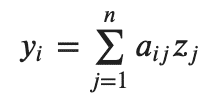
where a is a weighting factor (our underlying model is a bit more complex and follows [2]). What we want to get from the input-output tables is this weighting factor a for all sectors. Let’s call the matrix containing all this weighting factors A.
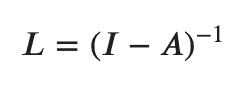
This is not the end of the story -but don’t worry, we are very close. As some readers may have already noticed, A tells us the direct, pair-wise connections between industries. But what happens if consumers stop buying from sector i, which as a result use less output from sector j, which in turn stops using sector k’s outputs? How do we model these indirect, more complex connections? Here comes the beauty of Leontief’s model and, more precisely, Leontief’s inverse matrix, defined as:
Leontief’s inverse matrix is central to our approach. To see how it’s relevant, note that the (i,j) element of the Leontief inverse measures the importance of industry j as a direct and indirect input supplier to industry i in the economy. What’s more, the (i,j) element accounts for all possible directed walks (of various lengths) that connect industry j to industry i over the network.
That’s it! We just need to get from the input-output tables to Leontief’s inverse. The process to construct the matrix is as follows:
- First, we take the matrix of trade flows between sectors (the raw table), which we call Z. We will aggregate all non-essential sectors, following the Italian government’s decree from the 22nd of March. The reason why we do so is to reduce the complexity in the interpretation and visualisation of the results for other sectors, but the analysis is not compromised by this aggregation.
- Second, we construct the column vector x, which represents the total production by sector (see image above).
- Third, we combine x and Z to get matrix A, which gives us the coefficients matrix. As explained above, the difference between A and Z is that Z represents trade flows, whereas A represents the input linkages in terms of relative proportions (assuming a Cobb-Douglas production function).
- Finally, we construct the Leontief inverse L from A, since the Leontief inverse is defined as L = (I-A)^(-1).
Let me introduce you to our Leontief inverse! The image below represents the intermediate consumption of Spanish sectors, each row and column representing a different sector. In this representation, sectors in the rows would be producing what sectors in the columns are consuming, while the colour shows the intensity of the linkage (the lighter, the stronger the linkage). For instance, in cell (22, 3), a particularly shinny one, sector 22 would be consuming a relatively high amount of what is produced by sector 3.

A static shock to the system
We want to measure what happens when parts of the economy shut down. To do so, we need to model how we “switch off” a sector from the matrix (partially or totally). The idea is to see how this shock to one sector affects other parts of the system. Let us first start by seeing what happens when we alter one sector’s total output once.
To shock our system, we are going to propagate a change in the production of one sector throughout the rest of the network using the Leontief inverse matrix. The way we will shock a sector is by shocking its final output vector, which we have called x. This will give us a vector of shocks whose entries will be the first-order change in the output of all sectors (i.e. zero in all but for the shocked sector). We will then take the dot product of the Leontief inverse and the shocks vector, which will give us all the direct and indirect changes in all sectors. Finally, we’ll add it to the original outputs vector, getting the new “state of the world” after the shock.
We can think of our shocks at two levels of granularity:
- At a higher level, we may want to see what happens when you shock a sector’s total output. This allows us to answer the question “what happens when one sector reduces production by X%“, and it is simpler to work with -we just reduce or increase a sector’s total output.
- At a more granular level, we may take into account the fact that the final demand (matrix Y) has different components (think of households’ consumption, public consumption, investment, etc.). We can shock specific components separately, thereby answering a question such as “what happens when the government reduces its consumption from sector Y by X%“.
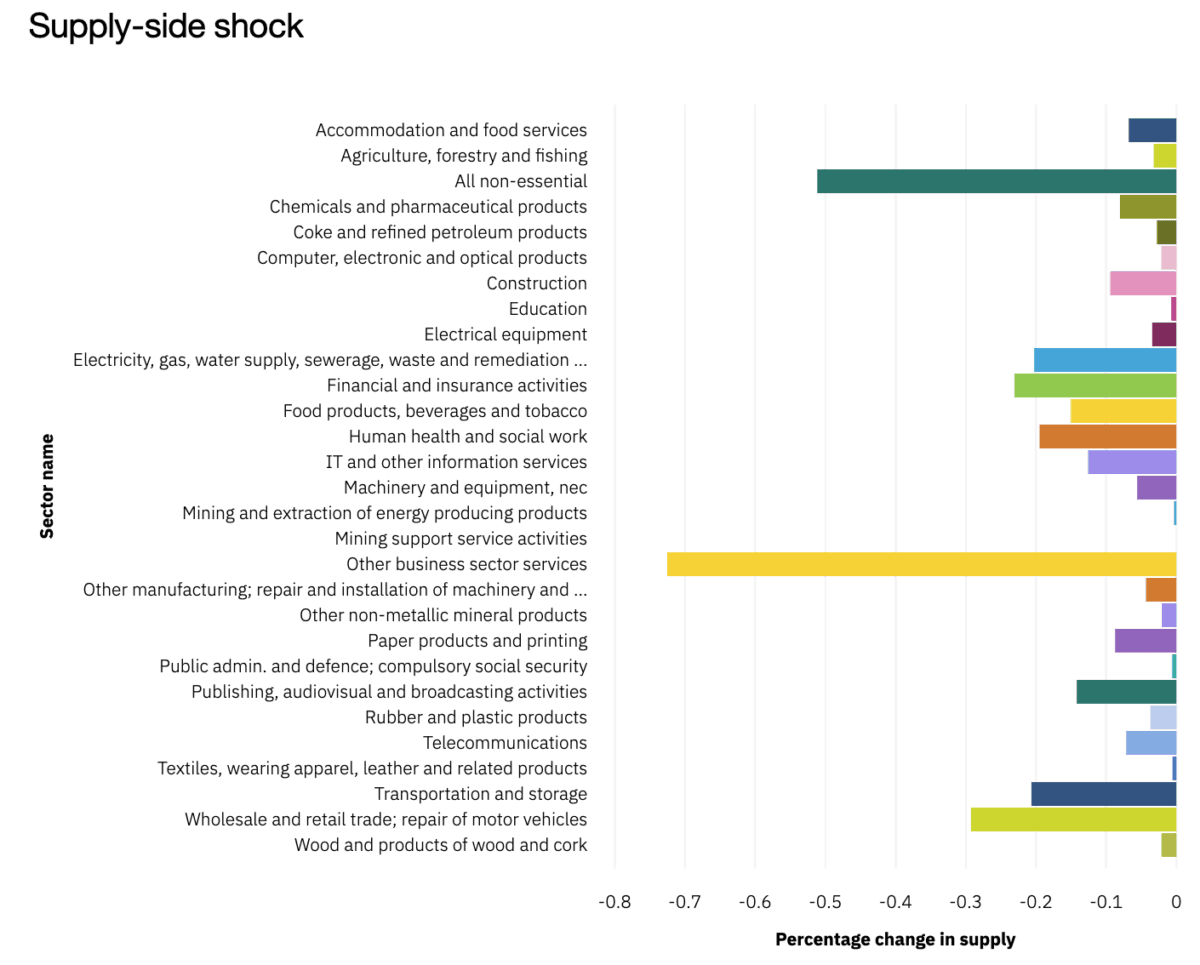
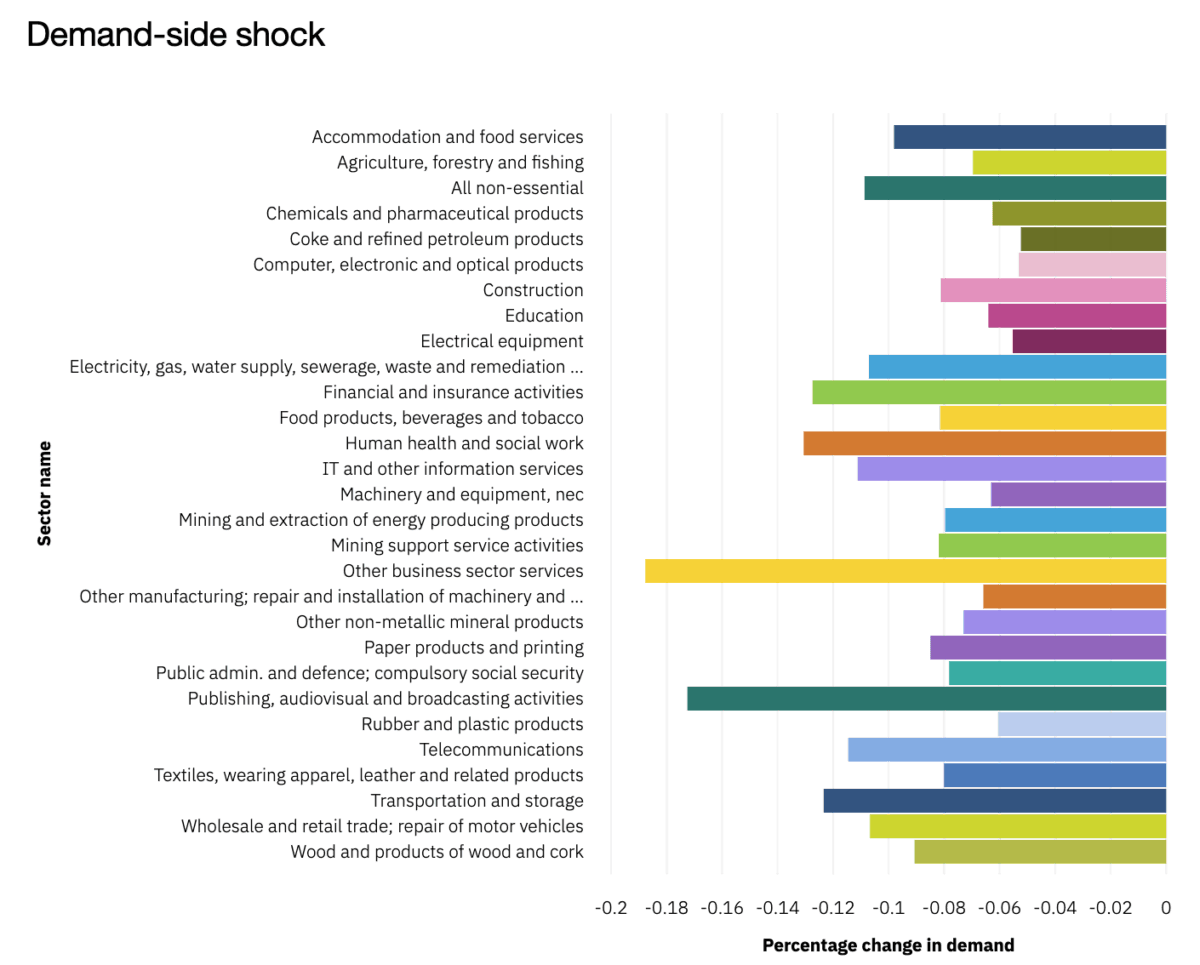
Last, but not least, we can apply two types of shocks to the system: supply-side and demand-side shocks. The difference between a supply-side and a demand-side shock is the direction of the propagation of the shock: demand-side shocks propagate upstream or, in other words, they affect all industries that the shocked sector purchases its inputs from. On the other hand, supply-side shocks have an impact downstream, meaning that they will affect all industries that rely on the shocked sector as a supplier. The difference between demand- and supply-side shocks in our Leontief inverse is subtle: a supply-side shock from sector i to sector j is captured by the (i,j) element of the matrix. An equivalent demand-side shock would be captured by the (j,i) element (note how we flip the indices) The difference between these two types of shocks is not trivial! In the below images you can see how similarly sized demand- and supply-side shocks to the Machinery and equipment sector affect the German economy differently. As we can see, in the case of the supply-side shock, most of the sectors of the economy suffer a relatively small contraction, except for the hard-hit Other business sector activities and All non-essential sectors (which includes activities such as mining and quarrying). In the case of the demand-side shock, the shock is more evenly distributed, with the output fall in the Other business sector activities sector being four times smaller now.
Dynamics of shock propagation and dissipation
It is worthwhile to take a moment to analyse the nature of the response to economic shock as computed by the I/O model. An economic network at steady state is subjected to a shock. A simple application of the Leontief model computes the contraction of economic output (on account of the shock being negative). Contraction and Recovery of the economic output are assumed to be instantaneous, completely ignoring any sort of dynamical nature of the response.
In order to derive a richer dynamical response, we follow the approach of Klimek et. al. (2019) and model the response to demand shock by a first-order ODE. For ease of analysis, it is assumed that the Input-Output matrix does not change during the time interval of interest i.e. order 1 ODE with constant coefficients. If now a shock of say 0.01 units were to be applied to Sector 28 in Germany (Machinery and equipment), the question of interest is to figure out how the other sectors, say again in Germany, respond to it.
A simple numerical solution of the system response is shown below, with the top plot showing the exogenous shock and the bottom plot showing the endogenous response of the network.
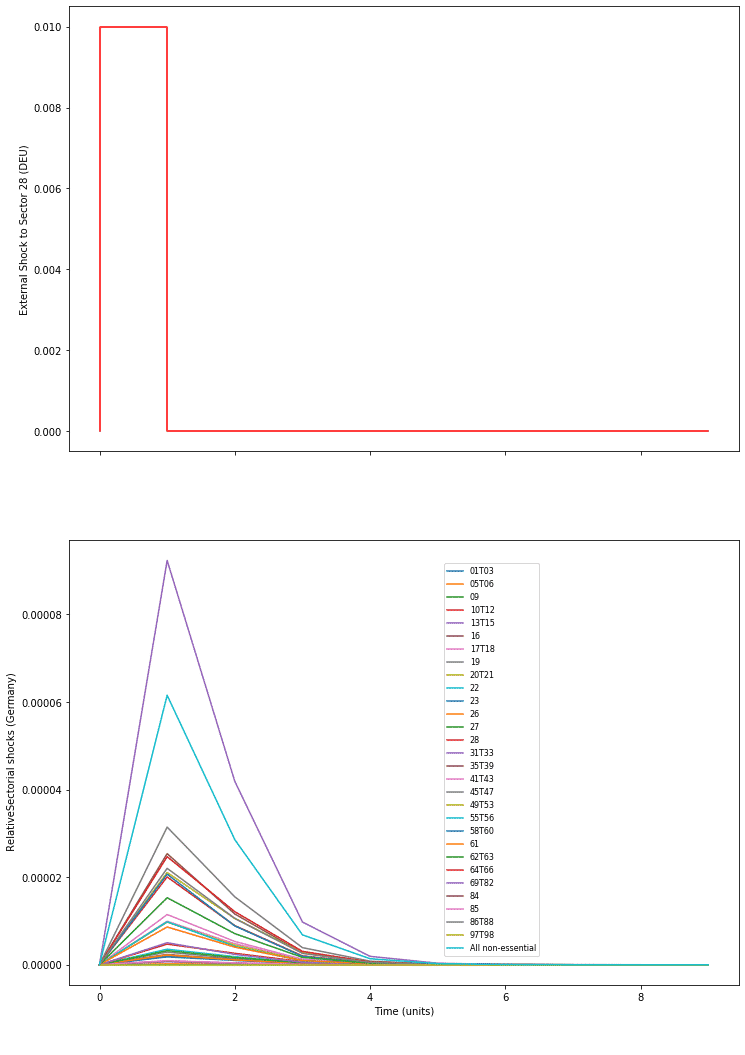
Of particular interest is the following observation that not all sectors show similar dynamic response profiles. Based on the dynamic response, a simple time measure can be derived that roughly captures the delay of one sector reacting to a shock in other.
It is crucial to understand the limitations of this approach. In the long run, input-output linkages are not static but naturally evolve as a result of the shocks that they are subject to. For example, if a sector shuts down completely (or increases its prices a lot), a downstream company in another sector may suffer in the short term, but after a while, it will alter (or substitute) its mix of inputs to overcome this situation. Clearly, the modelling and analysis presented here are not suited for long term forecasting.
Summary and Outlook
In this blog, we have shown how we can model the impact of a shock to different sectors of the economy using Leontief’s Input-Output model. This model is particularly relevant to answer some questions that have arisen as a consequence of the Covid-19 pandemic, namely what can happen when parts of the economy shut down. Looking at economic shock dynamics, it is clear that the effects of current lockdown are bound to last even for some time after return to “normality” unless a positive stimulation were to be applied.
Further work is being carried out in calibrating the depth and width of shocks to certain key sectors in the context of current events to make the simulation more insightful for policymakers and decision-makers and also the greater general public.
Authors:
Álvaro Corrales Cano is a Data Scientist within IBM’s Cloud Pak Acceleration team. With a background in Economics, Álvaro specialises in a wide array Econometric techniques and causal inference, including regression, discrete choice models, time series and duration analysis.
Deepak Shankar Srinivasan is a Developer in R2 Data Labs, Rolls Royce Deutschland, Germany, specializing in Data Science applications for Equipment Health Management and Deep Domain Specific Smart Assistants
Special thanks to Klaus G Paul, Elaine Begley, Maria Ivanciu, Erika Agostinelli, Scott Couper and Charlie Stanley.
We are a team of data scientists from IBM’s Data Science & AI Elite Team, IBM’s Cloud Pak Acceleration Team, and Rolls-Royce’s R2 Data Labs working on Regional Risk-Pulse Index: forecasting and simulation within Emergent Alliance. Have a look at our challenge statement!
[1] Leontief, W. (1951). Input-Output Economics. Scientific American, 185(4), 15-21. Retrieved from www.jstor.org/stable/24945285
[2] Carvalho, V.M., Tahbaz-Salehi, A (2018). Production Networks: A Primer. Working paper (Forthcoming in The Annual Review of Economics). Retrieved from http://vasco-m-carvalho.github.io/pdfs/ProductionNetworks.pdf
[3] Image taken from OECD (2018), OECD, Inter-Country Input-Output (ICIO) Tables, 2018 edition, ReadMe_ICIO_CSV.xlsx, URL: http://stats.oecd.org/wbos/fileview2.aspx?IDFile=b7d4d4ed-c6ea-44e0-9b13-e1daf28301dc, last accessed: 30 June 2020
[4] OECD (2018), OECD Inter-Country Input-Output (ICIO) Tables, URL: https://www.oecd.org/sti/ind/inter-country-input-output-tables.htm, last accessed: 26 June 2020[5] Klimek, P., Poledna, S. & Thurner, S. (2019). Quantifying economic resilience from input–output susceptibility to improve predictions of economic growth and recovery. Nat Commun10, 1677 https://doi.org/10.1038/s41467-019-09357-w