
Preface
In our earlier contribution, we analysed the impact of Covid-19 on economic networks by modelling it as an exogenous shock, the effect of which was modelled by a simple ODE following the approach investigated in Klimek et. al. [1]. In particular, we saw how the initial shock propagates across time (dynamic effect) and sectors (Input-Output table). Now, we explore an analytical strategy which models the counteraction against the economic depression caused by the shock. Our approach is to represent a stimulus in the form of extra resources injected into the system by external actors such as governments or other public authorities. We keep our approach at a relatively high level of abstraction, in the sense that we do not provide any guidance on how to inject the resources into the system, but rather assume that the resources get to the system. Therefore, in this note we would like to extend the analytical methods and simulation to throw light on the following questions:
- How much does the economy contract and how do the dynamics of the shock dissipate when countermeasures are applied?
- Could we derive insights on different strategies for countermeasures?
The practical purpose of our work is twofold: first, it is meant to help policymakers and business leaders understand the likely macroeconomic consequences of lockdown measures (or, more broadly, any measures that target specific sectors of the economy). Second, it provides a methodology to design counteraction strategies against the negative effects of such lockdown measures.
Analytical Formulation
We consider the following analytical formulation:
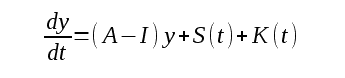
where y denotes the contraction of economic output; A and I denote the coefficient matrix of the Input-Output model and Identity matrix of corresponding rank respectively; S denotes an external economic event (what we called shock in our previous note) and K denotes the sector-wide economic stimulus (think of it as some sort of countershock).
Note the following:
- We disregard stochastic effects with the reasoning that the magnitude of shock vector drives the primary economic response.
- Vectors S(t) and K(t) are considered to be signals of finite energy and time duration. Intuitively both are represented by step signals of some duration. In fact, in the light of current events, it is becoming seemingly appropriate to model S(t) as a prolonged depression lasting for at least some months (any guesses when the vaccines would be approved anyone?). This depression would be an artificially imposed departure from the economy’s natural steady state caused by policies to control the spread of the virus (lockdowns, travel restrictions, social distancing, etc). On the contrary, K(t), the economic stimulus, could take different shapes: from long-lasting measures such as furlough schemes to policies more localised in time such as the UK’s Eat Out to Help Out scheme.
- Matrix A is constant during the time period of interest. This is a strong assumption. In the long run, the economic impact of Covid-19 will likely force companies to completely redesign their supply chains, substantially changing the input-output linkages of economies worldwide. For ease of analysis, we maintain the input-output matrix constant.
Within this formalism, the total contraction of economic output is given by
where the integral runs over all sectors.
Now we see that there are multiple alternatives regarding choice of vector K(t), which we will notionally identify with policies. A policy (analogous to the concept in Reinforcement Learning) refers to the action (i.e. the counteraction / stimulus against the shock) that agents undertake. These can loosely be seen as potential public policy actions that the government or other authorities can put in place, although we do not provide any normative advice into how these policies should be implemented in practice. There are multiple strategies for choosing policies of which we consider a couple of them here:
- Economy-wide Stimulus – A finite amount Stimulus is applied across all sectors. This considers eventuality of kickstarting a holistic recovery.
- Targeted Stimulus – Stimulus is applied only for the sectors directly exposed to the economic shock. This is meant to provoke an aggressive recovery of the affected sectors. Alternatively, we can also stimulate other sectors of interest. For instance, a policy maker may want to offset a shock to the coal industry by targeting more resources to green energy projects.
The total contraction of output and Speed of Recovery is used to judge quality of response to a stimulus. There could plausibly be other metrics to judge the quality of the response to a given stimulus. Again, if a policy maker is interested in channelling resources through green industries to promote a shift towards a more environmentally friendly economy, her main goal may not necessarily be economic growth.
Within the analytical formulation mentioned above, it appears we have 3 different regimes for economic output response [2]:
- As soon as the persistent shock sets in and before counteraction stimulus has been applied, the rate of output contraction is seen to start exponentially before becoming more linear.
- The application of stimulus causes initially a step change in the direction of economic recovery. However, it is not sustainable still in the sense that the step change recovery starts to decay exponentially as well as the shock is still present.
- The end of persistent shock causes the system to recover sustainably. The recovery is initially exponential but soon it becomes linear causing the contraction to shrink to null in the long run.
Simulation Framework
To put our framework in practice, we have created a browser-based application that allows us to experiment with our model. It is called E3: The Emergent Economic Engine. A beta version of the application is publicly available in this link. We have published the code in our Github repo here.
E3 captures the spirit of our work at the Emergent Alliance around what-if simulation. Its purpose is to model different scenarios, where we are able to choose the different parameters of our model. Our choice can be based on forecasts about what sectors are affected by a policy and for how long they will be affected. We can also input data-driven insights about how much a shock to a sector could have propagated throughout the rest of the economic network. We hereby invite readers to download the app and conduct their own simulations.
Our design is centred around two levers: the economic shock or depression (vector S(t) above) and the strategy to offset it (vector K(t)):
- First, we set up the economic shock, or vector S(t) in our formulation above. We can choose the duration of our simulation in years, the direction of the propagation of the shock (upstream or downstream), a generic, economy-wide shock (optional) and the sectors that we want to shock specifically, up to 5. The application will yield two graphs: one with a path for the propagation of the shock throughout the network over time, and another one with the total output change as a result of this shock by sector. We will also get the total output change for the whole economy.
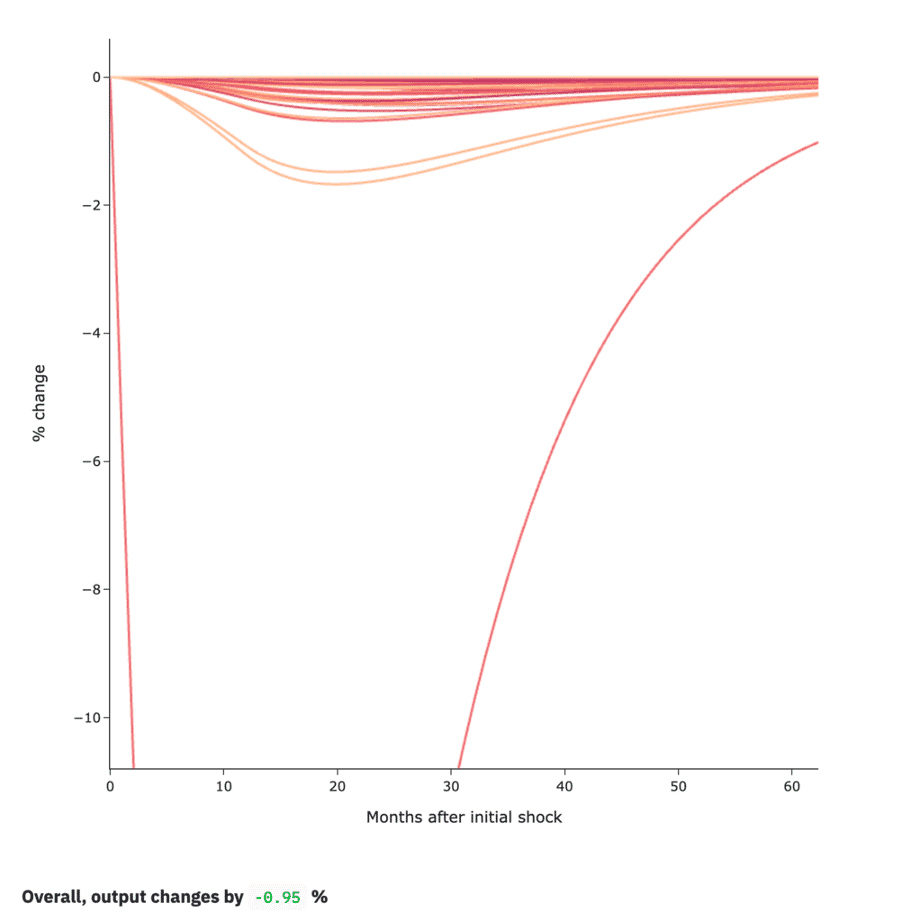
In the image below, we can see an example of what the first chart looks like. We have passed an upstream shock to the Air transport sector of -66.7% lasting for 12 months. The chart shows how the different sectors of our model react over time, each line representing a sector (we have zoomed in to show the dynamics more explicitly, resulting in a visual discontinuation of the line corresponding to Air transport). At the bottom, you can also see the overall contraction of the economy.
The second chart on this lever gives us another view on this result, showing us the overall output change by sector. To continue with the Air transport example above, the following chart shows the contraction by sectors (excluding Air transport itself):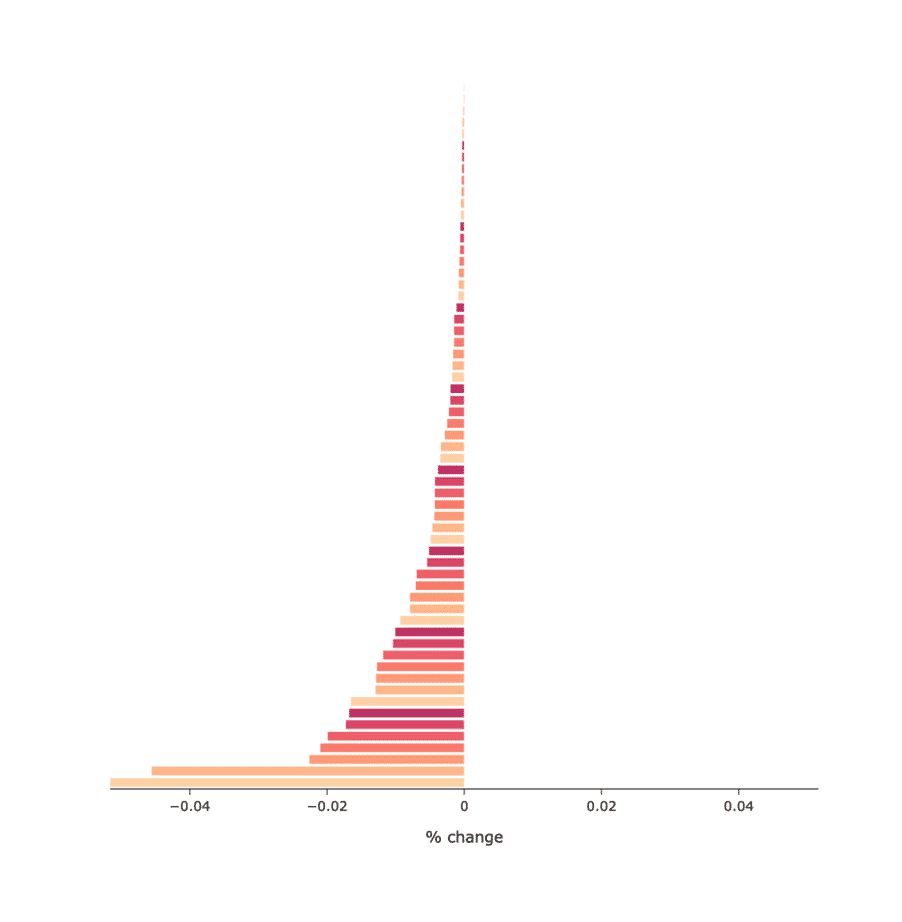
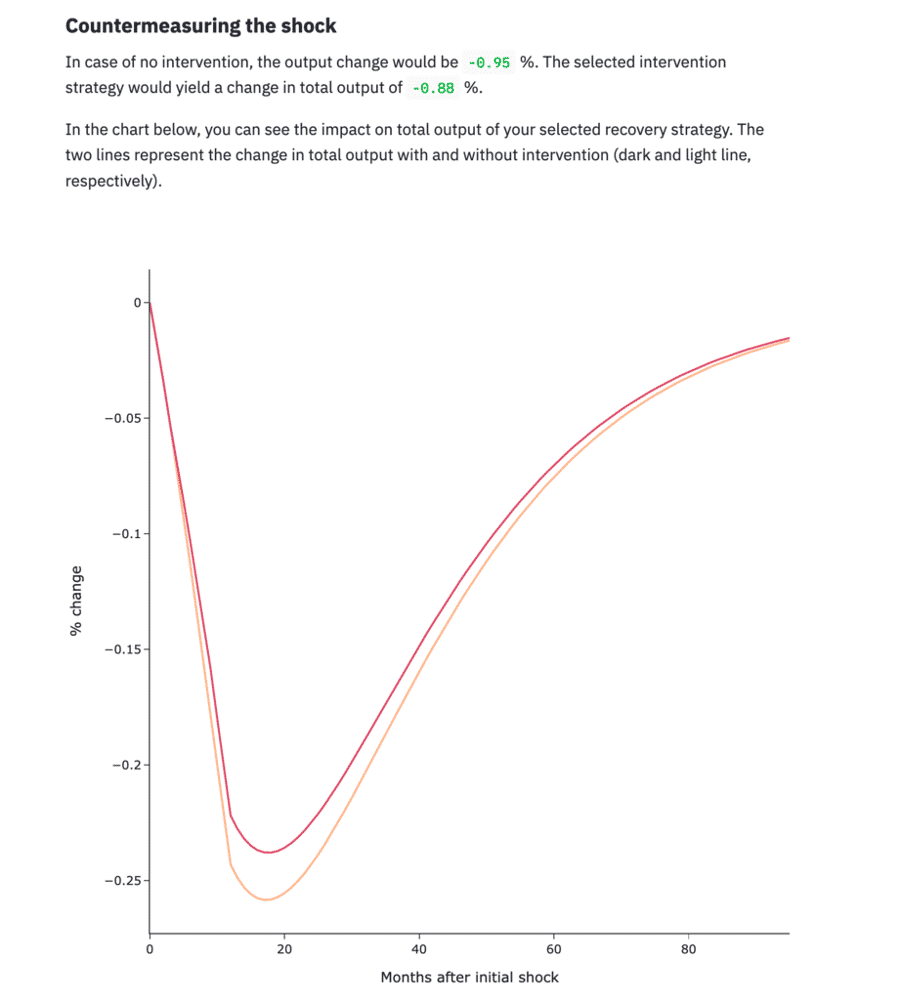
- The second lever of the E3 application corresponds to the strategy to countermeasure the economic shock. It is an optional lever, in the sense that we do not need to specify any recovery strategy to get a meaningful result on the previous lever. In this part, we can specify how we want to shape our strategy: we can choose either economy-wide measures and/or target specific sectors (up to 5). The application will output an estimate of how much the economy will contract in case of intervention, as opposed to not doing anything. Additionally, it will also show the recovery path of the economy in the two scenarios in a chart.
To continue with the example above, imagine that, 3 months into the air transport sector crisis, the government wants to subsidise it with an amount equivalent to about 6% of its total yearly revenue, spread over a period of 6 months (remember we set the shock to last for 12 months). The output of the app will be the following.
Illustrative Simulation
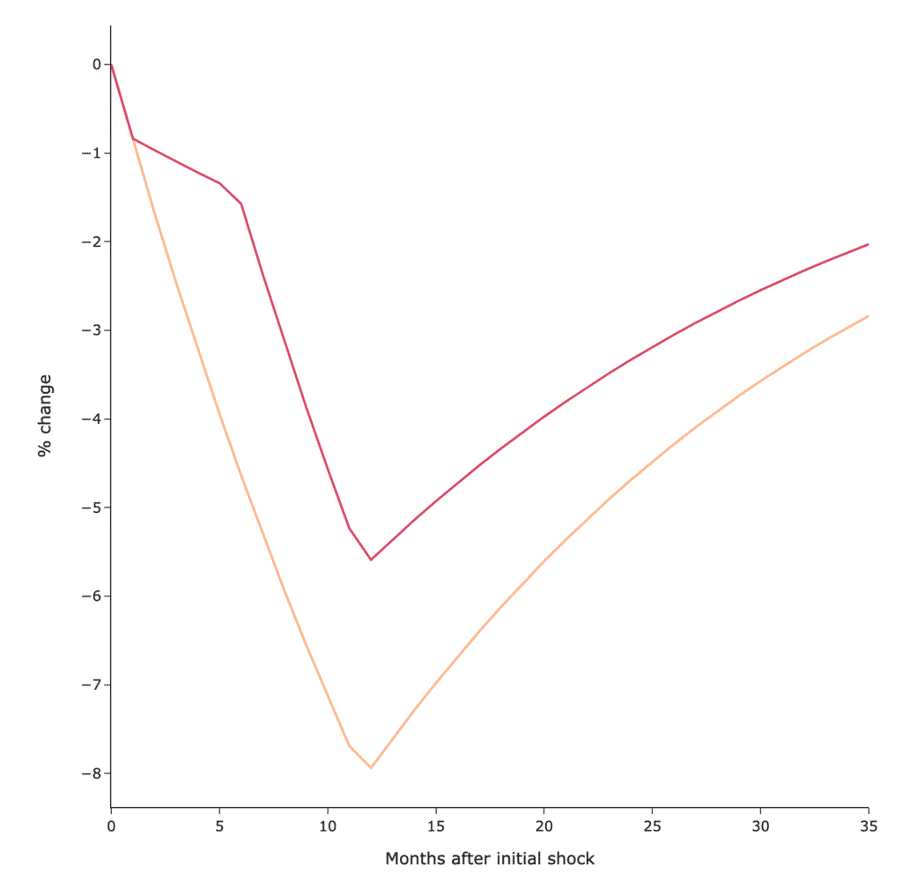
Consider the following scenario: Take the economy of the UK, for which the I/O matrix is publicly available here for the year of 2016 [3]. It has a total of 64 sectors. We apply an upstream shock to the economy lasting for 12 months of -10%. In other words, you can think of this shock as the pandemic lasting for one full year, in which the economy keeps falling a total of 10% relative to its pre-pandemic level. (Roughly, as we are talking about an upstream shock; propagating the shock downstream would yield a similar result.) Additionally, based on current projections, we assume the Air transport sector will fall by 66% in this period. We would like to point out that these are merely “guesstimates” to illustrate the utility of the approach and by no means a definitive figure, nor a prediction of any kind.
To countermeasure this (certainly grim) scenario, we “pump” an economy-wide stimulus amounting to up to 8% of total annual production one month after the pandemic kicks in and for five months. This is overall what the UK government injected to the economy in the form of a fiscal stimulus from April to August 2020 (here we follow Bruegel’s, a think tank, estimation [4]). The stimulus is assumed to be equally spread across sectors. This is a simplifying assumption, as not all the money was equally available for all sectors.
The results of our model suggest that the effect of this negative shock to the economy would imply a 14% decline in output over 3 years. With our countermeasure strategy, output fall is contained to about -9% over the same period of time. In the chart below, you can see the impact on total output of the strategy. The two lines represent the change in total output with and without intervention (dark and light line, respectively):
Summary and Outlook
In this blog we have presented our analytical strategy to model a countermeasure to an economic shock in a dynamical system with input-output linkages. This complements our past work on modelling the impact of sector-specific shocks on the whole economic network of a country. We have also presented the Emergent Economic Engine (E3), a tool that wraps these concepts into a browser-based application. This application allows the user to interact with our model specifying shock and countermeasure profiles. We believe this work is relevant for the Covid-19 pandemic, as it provides a framework to understand how locking down specific sectors can affect the whole economy, as well as to shape possible recovery strategies.
We believe further work should consider applying optimal control principles to design recovery strategies. For example, how should a fixed, finite stimulus be distributed across time and sectors to kickstart a chosen sector or the entire economy? What criterion should be considered? Quick but jagged response or slow but stable response? The insights generated by such an approach could turn out to be quite useful in understanding the dynamics of recovery.
Authors
- Álvaro Corrales Cano is a Data Scientist within IBM’s Cloud Pak Acceleration team. With a background in Economics, Álvaro specialises in a wide array Econometric techniques and causal inference, including regression, discrete choice models, time series and duration analysis.
- Deepak Shankar Srinivasan is a Developer in R2 Data Labs, Rolls Royce Deutschland, Germany, specializing in Data Science applications for Equipment Health Management and Deep Domain Specific Smart Assistants.
The authors would like to give special thanks to Maria Ivanciu, and Peter Klimek for their valuable feedback, as well as Rolls-Royce plc. and IBM for supporting this work.
We are a team of data scientists from IBM’s Data Science & AI Elite Team, IBM’s Cloud Pak Acceleration Team, and Rolls-Royce’s R2 Data Labs working on Regional Risk-Pulse Index: forecasting and simulation within Emergent Alliance. Have a look at our challenge statement!
References
[1] Klimek, P., Poledna, S. & Thurner, S. (2019). Quantifying economic resilience from input–output susceptibility to improve predictions of economic growth and recovery. Nat Commun 10, 1677 https://doi.org/10.1038/s41467-019-09357-w
[2] Analysis of input-output tables for deterministic shocks and countershocks (to appear Arxiv).
[3] Office for National Statistics (2020), UK input-output analytical tables – industry by industry, URL: https://www.ons.gov.uk/economy/nationalaccounts/supplyandusetables/datasets/ukinputoutputanalyticaltablesindustrybyindustry, last accessed: 27 August 2020. Contains public sector information licensed under the Open Government License v3.0. http://www.nationalarchives.gov.uk/doc/open-government-licence/version/3/
[4] Anderson, J., Bergamini, E., Brekelmans, S., Cameron, A., Darvas, Z., Domínguez-Jiménez, M., Lenaerts, K. & Midões, C. (2020). The fiscal response to the economic fallout from the coronavirus. Bruegel Datasets, URL: https://www.bruegel.org/publications/datasets/covid-national-dataset/, last accessed 24/09/2020