
Context and motivation
The outbreak of Covid-19 had a major impact on our everyday lives. In just a couple of weeks, all our habits were shaken: we started to wear masks, work from home, and maintain a safe distance from each other. These tremendous changes inevitably reflected on our economy: with people cooped up at home and the borders locking down, most commercial activities had to be temporarily suspended; some were even shut down permanently. The main question on everyone’s lips went from “When will the situation be back to normal?” to “Will the situation get back to normal?”. This study is an attempt to answer this question.
As the Covid-19 pandemic affects so many lives, it has been imperative for governments, individuals and businesses to track the way it has affected society. They need to foresee the consequences of the disease and lockdown measures and adapt accordingly. Tourism is an important component in the global economy and one of the most impacted sectors. In some regions of the globe, tourism is the dominant component of the local economy. We show in this blog that not only tourism economy has been massively impacted by the virus outbreak, but also the tourism destinations are changing.
Our method
At a high-level, our goal is to define as many “indicators” as we can to closely monitor society. An indicator can be virtually any metric, provided that we can measure it in a quantifiable manner over time. Since the Covid-19 outbreak has roughly changed every aspect of the society, any such indicator will likely see its trend or pattern scrambled around mid of March, when Covid-19 got viral and propagated all over Europe.
This blog focuses on tourism. The indicators of interest are the number and location of Airbnb properties booked over time. First, we look at how the number of bookings and we compare these numbers before and after the COVID outbreak. Not surprisingly, the pandemic has largely reduced the number of travellers and this is reflected in the number of bookings that dropped significantly as soon as the countries went into lockdown. Next, we looked at the destinations chosen by tourists after the outbreak. The assumption was that tourists would rather visit remote and less crowded places instead of densely populated areas.
Code Available on Github
Tourism in the UK
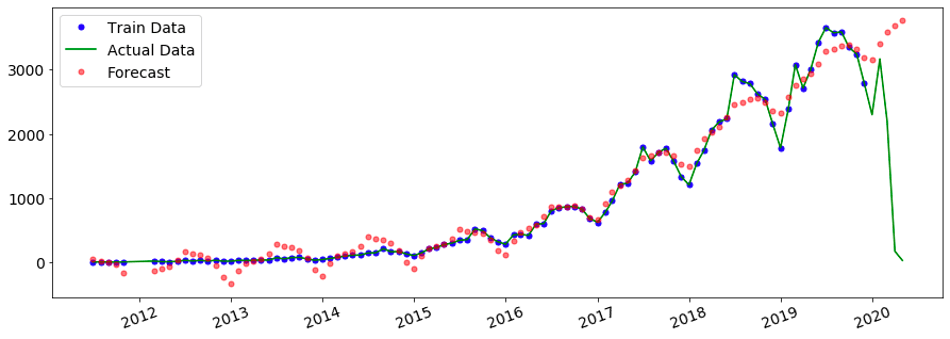
In many regions of the world, tourism is a seasonal and periodic process. The picture below shows the number of properties booked over time in Bristol, UK. We can see that tourism was growing exponentially in that region but also it has a clear seasonal component to it. It goes up in summer and down in winter.
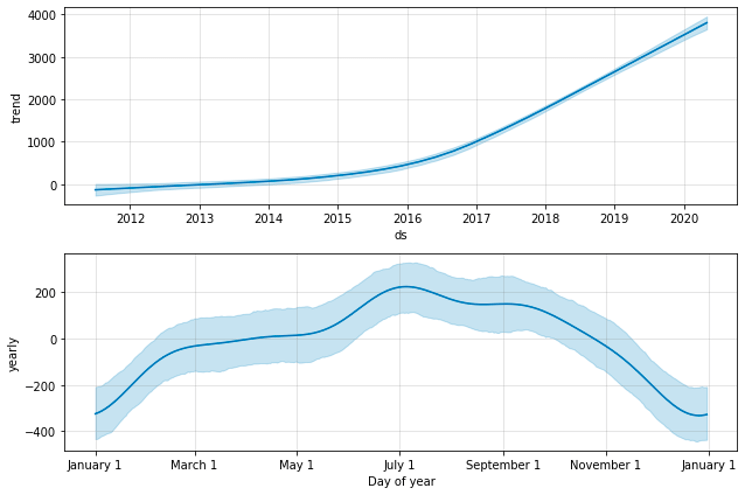
To better see the trend and period behaviour, we used the Facebook prophet open-source library to decompose the time-series shown above into its trend (top) and its yearly seasonality (bottom).
The same growth and seasonality have been observed in different cities in the UK, namely London and Edinburgh. The table below summarises the growth in the last six months, as well as the average monthly growth in these three regions.
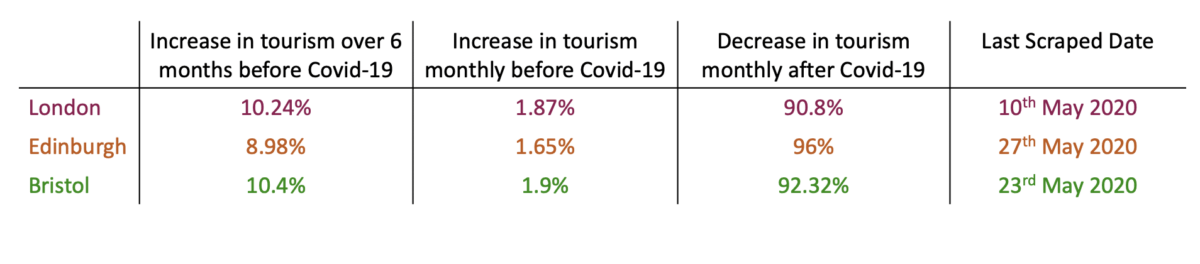
Note that these measures are computed based on the data downloaded from Inside Airbnb. Since the actual reservation dates of the properties are not available, we used the date of the reviews instead (knowing that a user can only leave a comment after he has rent a property). The dates of the reservations and reviews might slightly differ since in most cases, users will give a review only when their trip is over. In the future analysis, the team could consider shifting the date of the reviews (e.g. by subtracting 5-10 days) to estimate more accurately the check-in day of the user.
Without any surprise, we also see from the pictures above that the number of reservations dropped from the beginning of 2020, as soon as COVID hit the country and the European continent. In the next section, we will set our focus on the small number of reservations made after the end of the first quarter of 2020. We will show that, besides the crash of the number of reservations, something else happened: travellers are changing their favourite destinations from hot, touristic, crowded places for remote and less populated areas.
Geo-Distribution of tourism within UK
Even if the demand for Airbnb dropped dramatically due to the Covid-19 situation, tourism did not stop. People are still travelling. Looking at the geographical distribution of the number of Airbnb reviews over time offers a couple of thought-provoking insights into people’s behaviour.
As showed above, before Covid-19 crisis the trend in tourism has rapidly increased. However, people were usually choosing properties in the city centre, close to touristic attractions and lively places. When the lockdown started in the UK at the end of March, people’s choices started modifying.
Taking the number of reviews as an indicator for Airbnb demand and people’s mobility, we normalised the monthly data and obtained a geographical distribution of the most appealing neighbourhoods in three cities in the UK (Bristol, Edinburgh, and London). This method discards the effect of the drop in the number of reviews. In all three cases, the distribution starts showing a new trend in travelling just after the lockdown started in April 2020. We can see that an equivalent percentage of travellers who, before the pandemic, preferred the city centre as holiday accommodation are now choosing more remote areas. The effect of this behaviour may be a result of the fear of crowded spaces or it may show a lower budget for holidays. Due to incomplete data for May or June, we cannot make any further assessment.
However, where are these travellers coming from? Looking at the lockdown measures in the UK in April, the UK government advised against all non-essential travel. Taking this into account, it can be implied that tourism happens locally. In other words, the decrease of international flights and the present Airbnb travellers indicate local tourism.
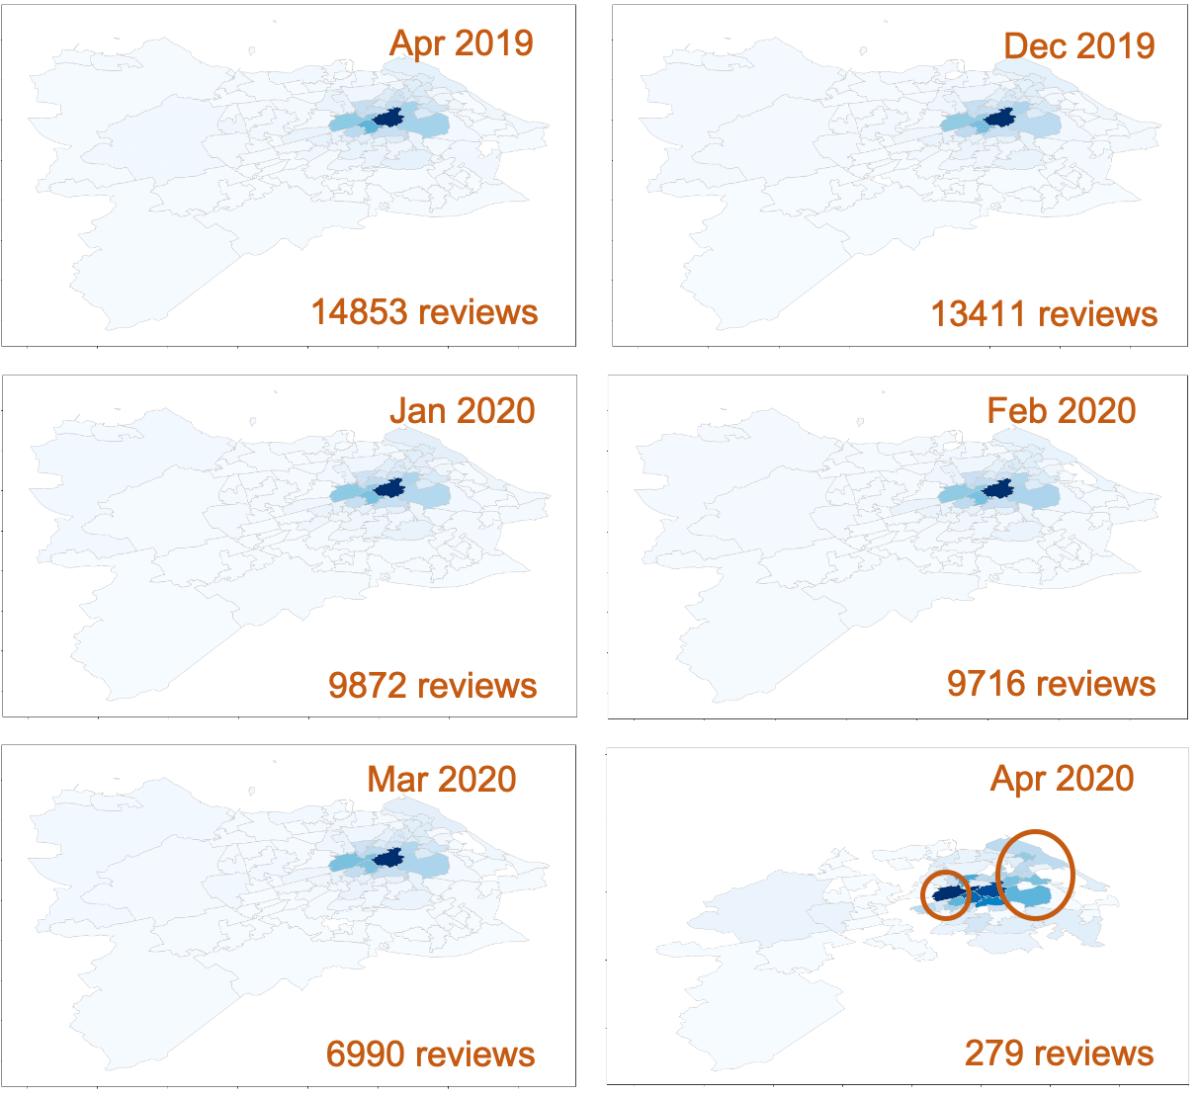
Fig 3: Edinburgh Neighbourhoods – Number of reviews distribution per month
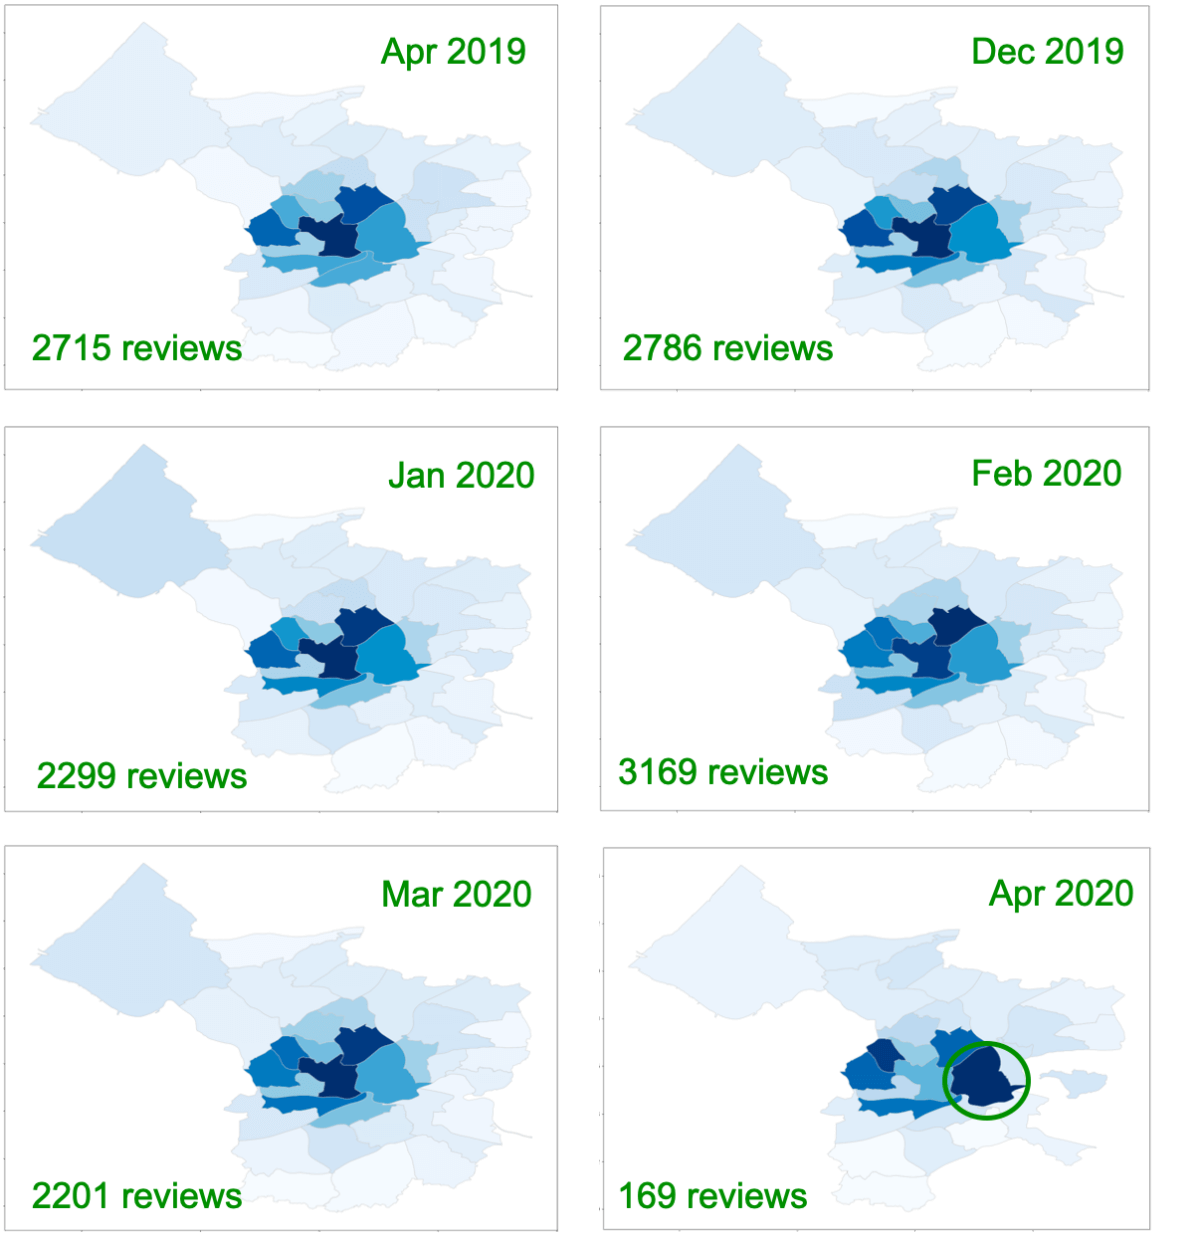
Fig 4: Bristol Neighbourhoods – Number of reviews distribution per month
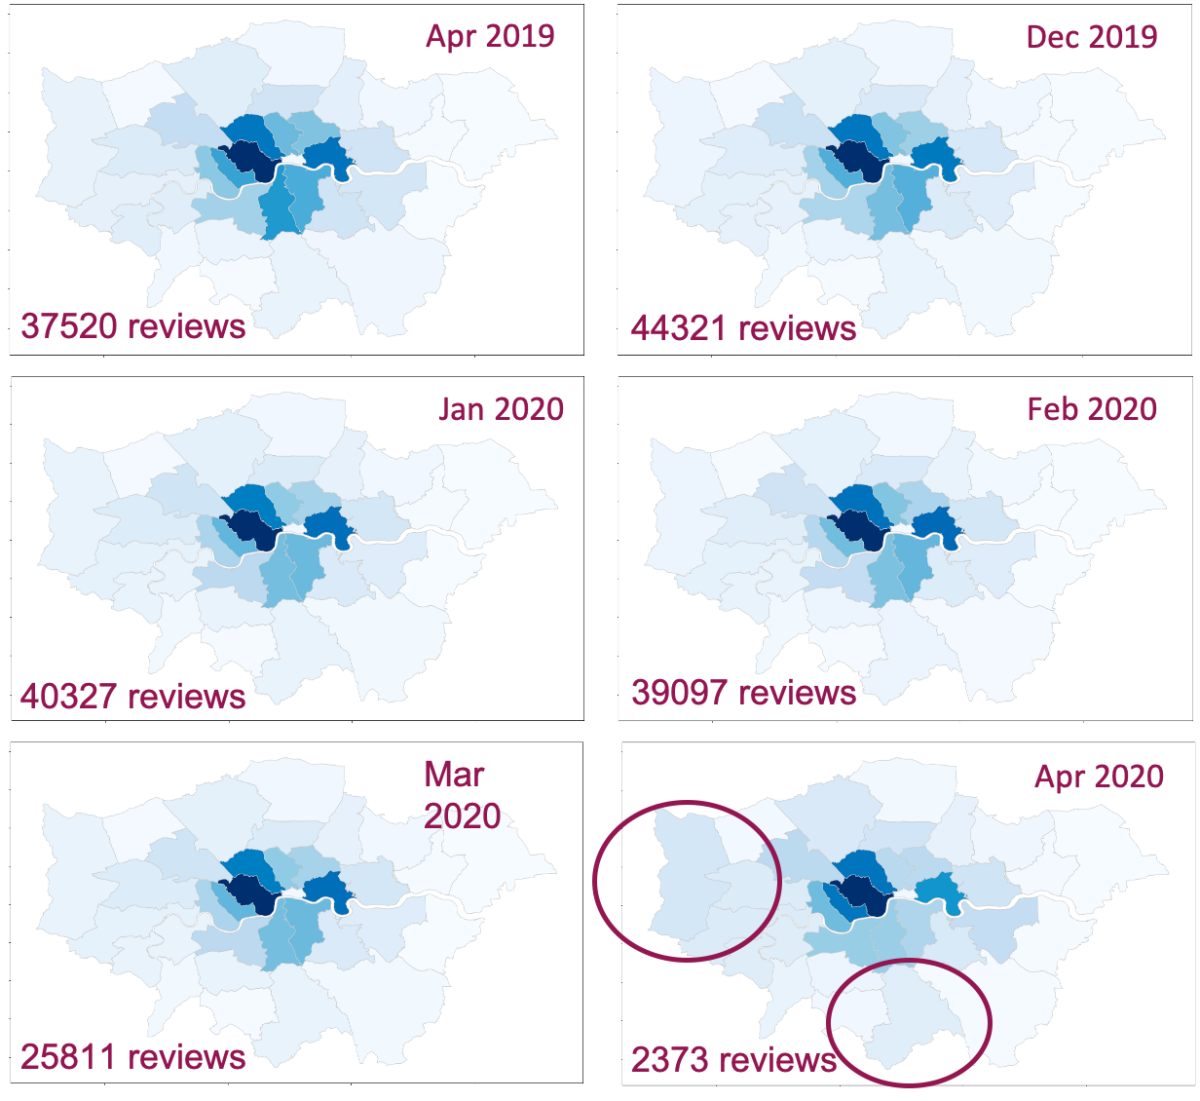
Fig 5: London Neighbourhoods – Number of reviews distribution per month