Context and motivation
The outbreak of Covid-19 had a major impact on our everyday lives. In just a couple of weeks, all our habits were shaken: we started to wear masks, work from home, and social distancing. These tremendous changes inevitably reflected on our economy: with people cooped up at home and the borders locking down, most commercial activities had to be temporarily suspended; some were even shut down. The main question on everyone’s lips went from “When will the situation be back to normal?” to “Will the situation get back to normal?”. This study is an attempt to answer this question.
Code Available on Github
Our method
At a high-level, our goal is to define as many “indicators” as we can to closely monitor society. An indicator can be virtually any metric, provided that we can measure it in a quantifiable manner over time. Since the Covid-19 outbreak has roughly changed every aspect of the society, any such indicator will likely see its trend or pattern scrambled around mid of March, when Covid-19 got viral and propagated all over Europe. The indicator that we consider in this blog is the overall sentiments conveyed in the news. We look into the diversity of topics discussed in the news and how their distribution and sentiment have changed over time. For our analysis, we used topic modelling and sentiment analysis following an NLP workflow as shown below.
As a first step, we ingested data from Socialgist, Oxford University’s Government Response Tracker [1], and the UK government and cleansed it through common NLP pre-processing techniques and libraries. The result is a well-formatted dataset ready for topic modelling and sentiment analysis. Next, we created plots to visualise the evolution of the sentiments over time.
All the details about the overall NLP approach and topic modelling are covered in the prequel of this blog at EmergentAlliance.org. Additionally, all the code for this analysis is made publically available on GitHub.
Results of the sentiment analysis
For this analysis, we focused on the following UK-based news providers from 1st of January till the end of May 2020:
The first two are for analyzing news that target the general public and cover a variety of topics. Also, we analyzed financial news to give a particular attention to financial topics as we know businesses have been widely affected by Covid-19.
Topics
Here we present our results from analysing the first two news providers content.
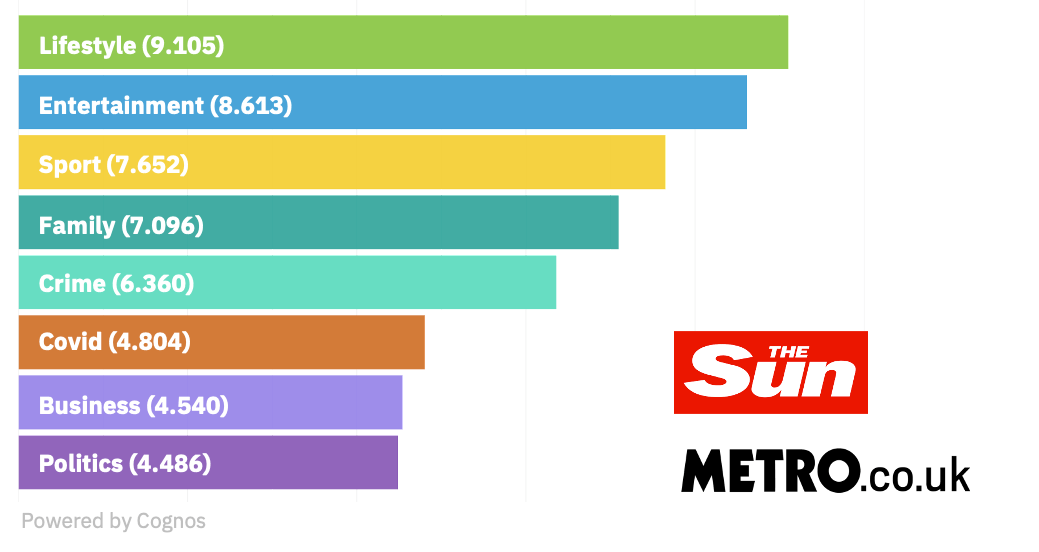
Our topic modelling has broken all the news into 8 topics: lifestyle, entertainment, sport, family, crime, covid, business, and politics. The number of publications in each topic is shown in the picture below.
Sentiment
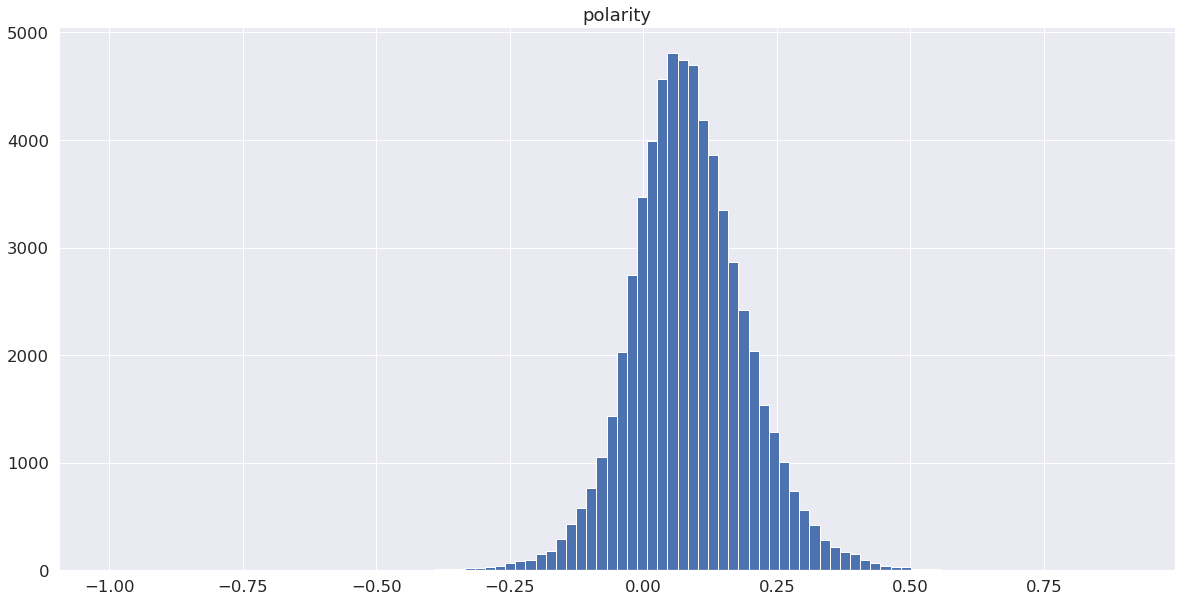
We have used the TextBlob library to compute the sentiment, which is composed of polarity and subjectivity. The following analysis is focused on the polarity metric.
The polarity of the topic is a number between -1 (extremely negative sentiment) and 1 (extremely positive sentiment). Yet we believe that expressing the polarity of a news article as a number is only meaningful when used relative to the polarity of another news article. As such, a polarity of 0.25 cannot be mapped to a specific English adjective that would characterise the intensity of sentiment. However, it can be interpreted from two articles with a respective polarity of 0.1 and 0.5 that the one with 0.1 is giving a more “positive” news than the one with a polarity of 0.5. The picture below shows the distribution of the polarity of all the articles.
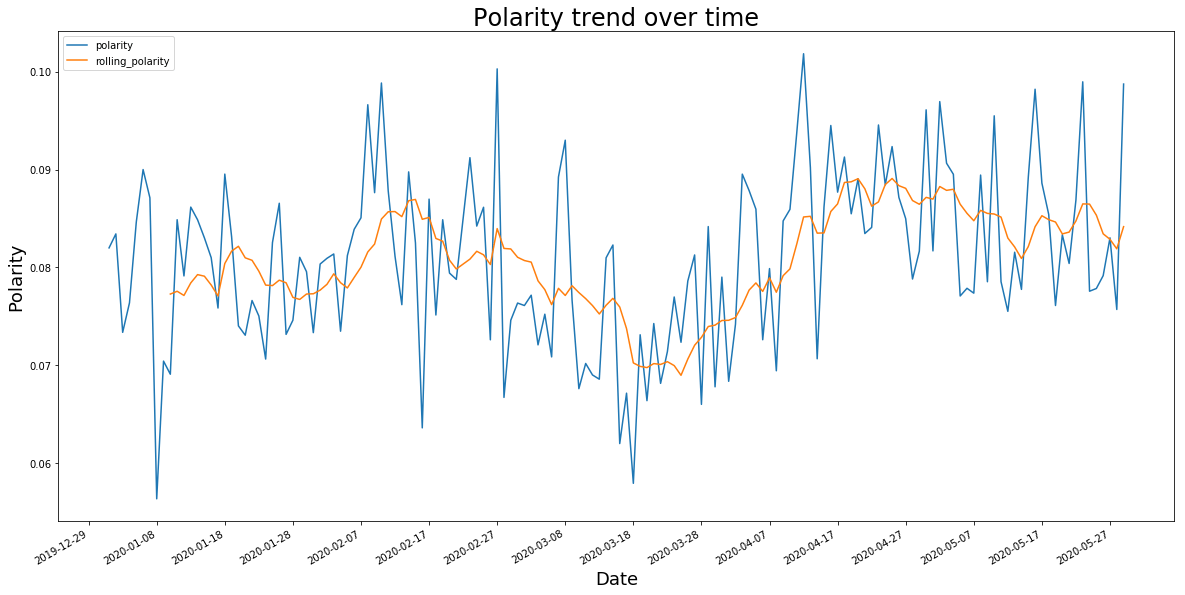
By looking at the evaluation of the average daily polarity across all news over time, we can see that the articles started delivering more negative news from mid-February till mid-March. After that, the polarity seems to gradually increase back to “normal”.
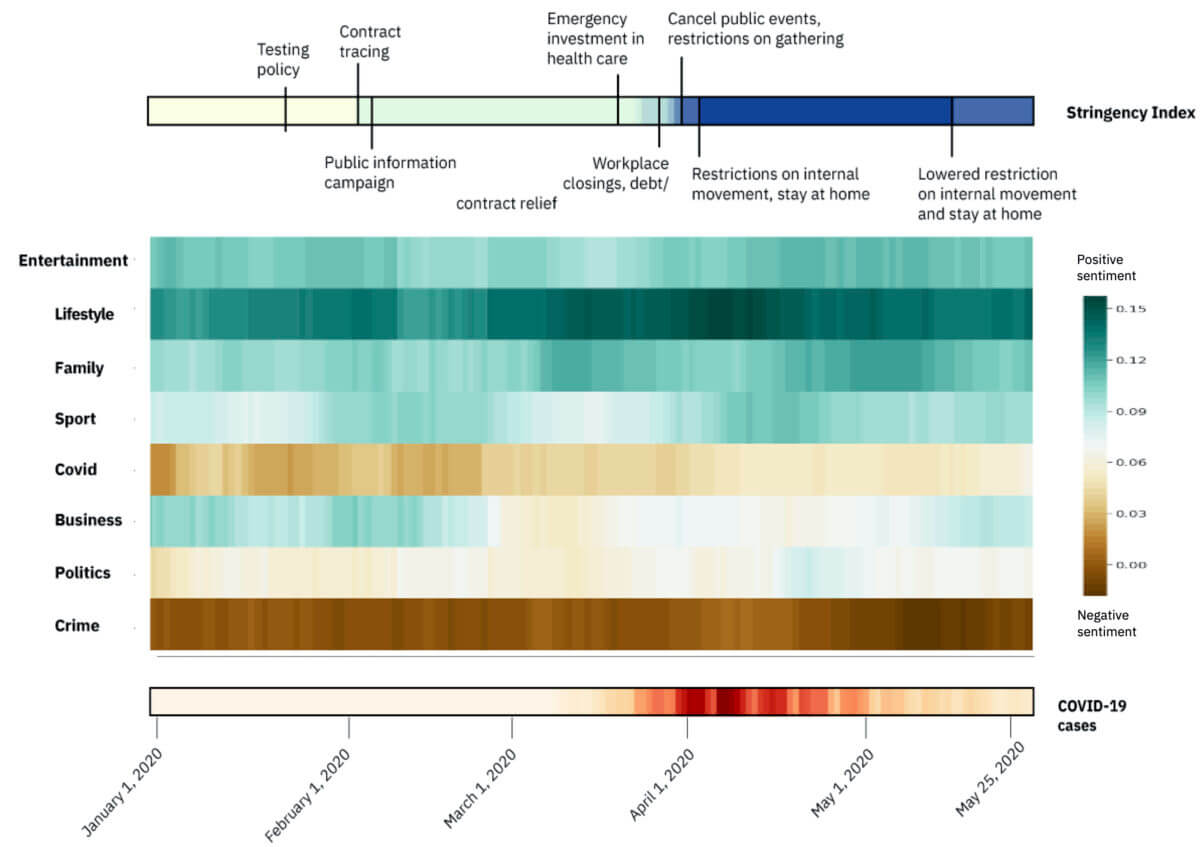
The picture below shows the evaluation of the polarity per topic over time along with the stringency index and confirmed Covid-19 cases in the UK. Oxford stringency index contains indicators of government responses to Covid-19 such as policies in containment and closure, economic policies and income supports, and health system policies.
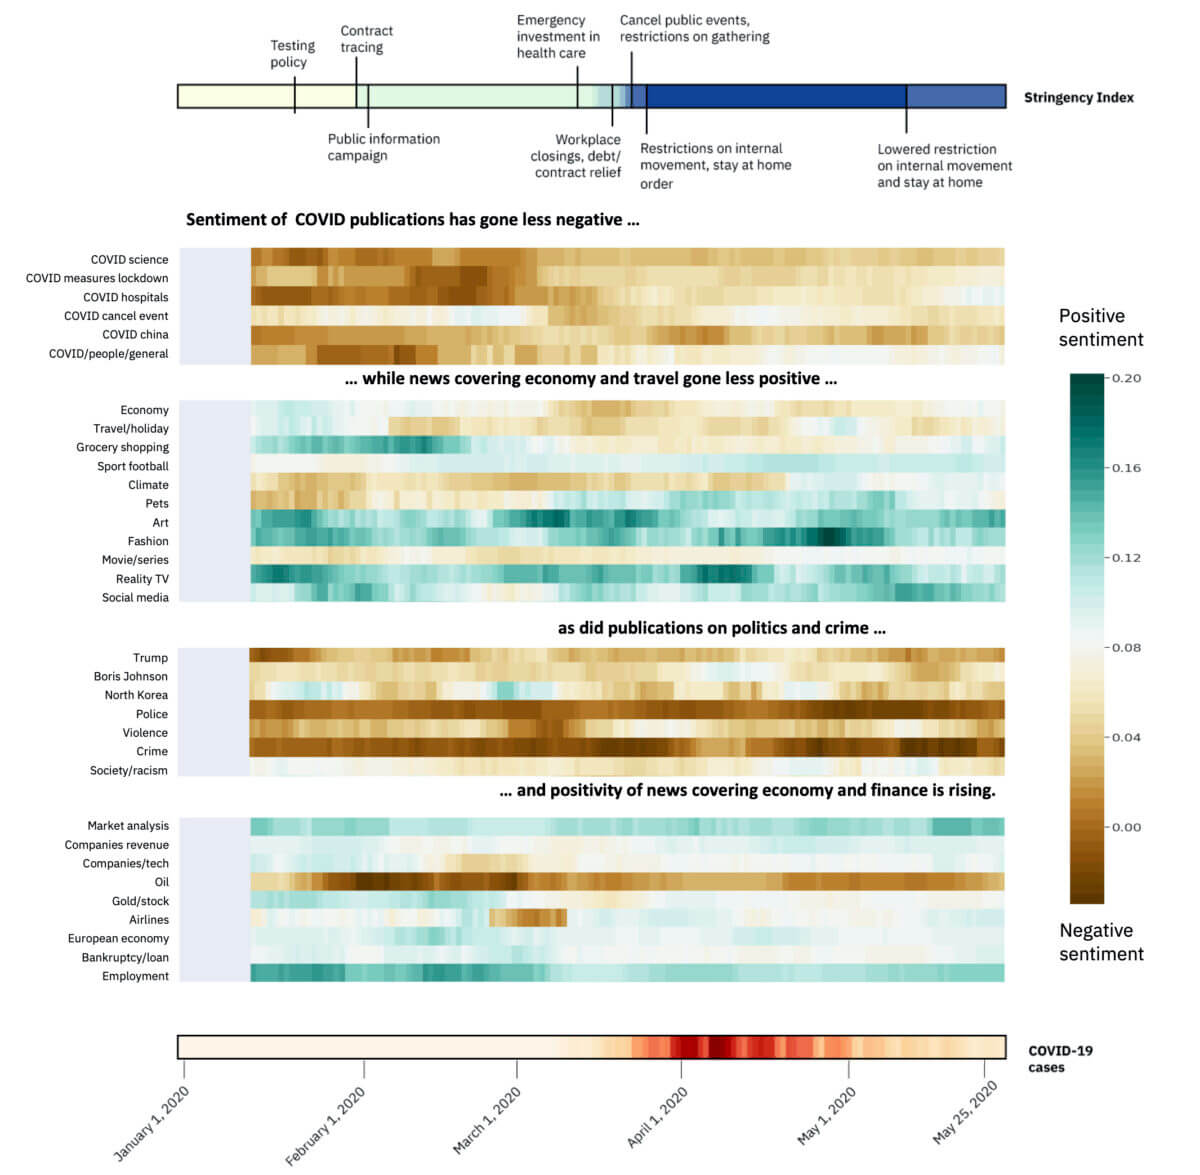
As expected, the “crime” topic is perceptibly more negative than the other topics, as there is rarely good news when it comes to crime. It is also encouraging to see that the polarity of the news about Covid-19 seems to have a less negative trend since the beginning of April. News about businesses and the economy, in general, are also getting better since the end of April. The polarity of the other topics remains rather steady over time.
The picture below shows the sentiment trends of topics derived from fine-grained sentiment analysis of topics where we focus on the sub-topics and their evolution of sentiment over time.
We can see the sentiment trends of Covid related topics, topics covering social issues and entertainment, as well as politics and crime. Finally, financial topics are presented as a result of the sentiment analysis on financial news from Bloomberg and MarketWatch.
Code Available on Github
Main Takeaway
Visualizing heatmaps of the sentiment of articles over time has shown us how media has been reacting to Covid-19 and different social and economical events. Sentiment analysis along with topic modelling for news content analysis are powerful tools to understand the sentiment of the topics in the focus of media content providers, and indirectly in the focus of our society.
Disclaimer: This information can be used for educational and research use. Please note that this analysis is made on a subset of news content. The authors do not recommend generalising the results and conclude decision-making on these sources only.
Authors:
Vincent Nelis is Senior Data Scientist with IBM Data Science & AI Elite team where he specializes in Data Science, Analytics platforms, and Machine Learning solutions.
Mehrnoosh Vahdat is Data Scientist with IBM Data Science & AI Elite team where she specializes in Data Science, Analytics platforms, and Machine Learning solutions.
Special thanks to Erika Agostinelli, Swetha Batta, Anthony Ayanwale, Rachael Dottle, Alexander Lang, and Mara Pometti who helped us in this work.
We are a team of data scientists from IBM Data Science & AI Elite Team, IBM Cloud Pak Acceleration Team, and Rolls-Royce R2 Data Labs working on Regional Risk-Pulse Index: forecasting and simulation within Emergent Alliance. Have a look at our challenge statement!
[1] Hale, Thomas, Sam Webster, Anna Petherick, Toby Phillips, and Beatriz Kira (2020). Oxford COVID-19 Government Response Tracker, Blavatnik School of Government. Data use policy: Creative Commons Attribution CC BY standard.

