
As part of our blog series on Regional Risk Index and COVID-19 modelling, this blog presents short-term predictions of COVID-19 cases and a case study on the prediction of ICU beds.
Introduction
Predicting how the number of COVID-19 cases will evolve in the future is of interest for many due to its potential to steer the decision-making process governed by healthcare and economy policy makers. This is especially challenging as being an unprecedented disease, the number of historical data points is not large yet and the understanding of its clinical characteristics, e.g., the percentage of recovered patients acquiring immunity, is still in progress. In this project, we aim to predict the number of beds required in hospitals for hospital resource optimisation.
Method
In the real world, there are always uncertainties caused by noise in measurements for the infection counts, e.g. underestimate for the asymptomatic population, and in the transmission process of the virus [1]. This fact encourages the application of filtering techniques, which are known to provide better estimates of a dynamical system based on the measurements from the past to the current time through a recursive Bayesian update [2]. We choose an Ensemble Kalman Filter, a Monte-Carlo variant of Kalman Filter where the approximation of state error covariance matrix is made by propagating an ensemble of model states using the updated states from the previous time step. Some examples that use Kalman filter for COVID-19 analysis can be found in [3, 4]. We set the number of ensemble members as 1000, process noise model as a discrete constant white noise model with a variance of 0.1, and the measurement noise as 1000.
We define the states and a transition model as follows:
- st : Infections at time t (our measurement)
- vt : Infection increase at time t
at : Infection growth acceleration at time t

Based on st (reported case numbers), the “speed” of increase vt and the “acceleration” of increase at are estimated through predict and update phases. Being a simple mechanistic model often used in real-time tracking of an object for estimating its future position, it is used to estimate the true state values of st, vt and at through filtering. Since the exact measurement noise model is unknown, we use a Gaussian noise model, a common choice for Kalman filters [2]. Our assumption is that the growth acceleration remains relatively constant in a short time period, and it is reasonable to make a short-term prediction (usually up to a week) using the estimated growth acceleration.
Result
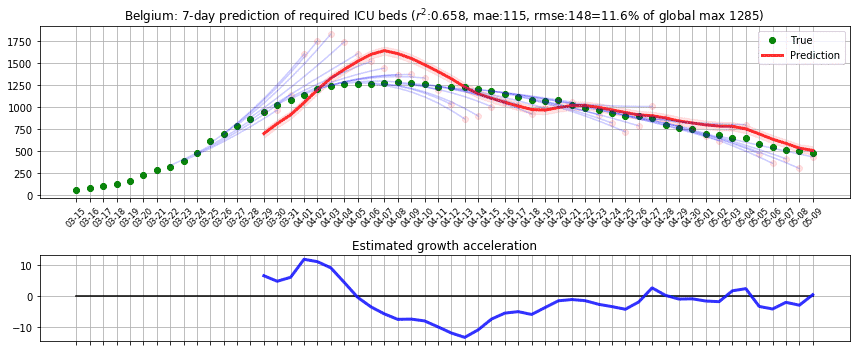
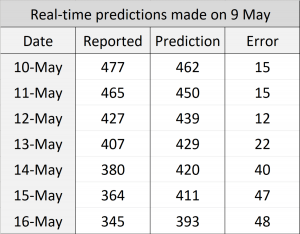
In the first phase, we applied the model to predict the number of beds required for intensive care units in Belgium and computed r2 and root-mean-square error (RMSE) scores based on the reported cases from [D1]. We applied the prediction on each day, predicting up to 7 days ahead by recursively applying with the estimated true state values. To assess the impact of RMSE score in the real world, we divided it by the maximum capacity occupied in the history of data, which we call RMSE rate. We initially thought of dividing the RMSE by the country’s total available ICU beds but realised that this may lead to an overly optimistic score because not all hospitals were included in the data. The following figure shows the result where green dots denote measurements, pink dots denote raw predictions with recursive prediction trajectories in blue, and finally solid red line which is the smoothed version of raw predictions. Estimated growth acceleration is also shown, when its value turns into negative on 5th of April. As a result, ICU bed numbers were predicted to be “suppressed” over the next few days, which is reflected in the data. r2=0.658, RMSE=148, RMSE rate=11.6%.
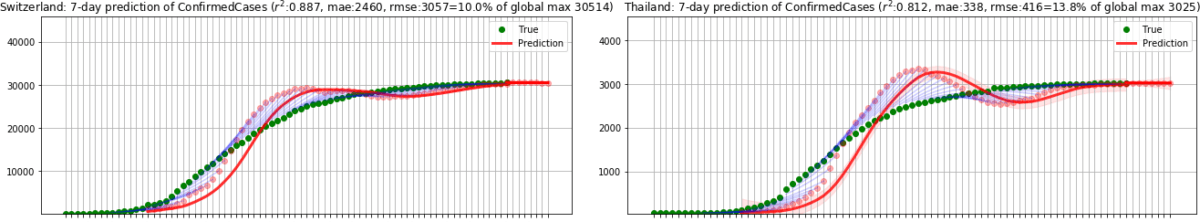
In the second phase, we ran the model until 31 July 2020, applying the same model to predict the number of total confirmed cases in 185 countries based on the reported cases from [D2]. Considering that every country has different population resulting in different scale in numbers, we computed the ratio to the maximum value of infected cases as we did in the first phase. As before, dividing by the total population may lead to an overly optimistic score if a country is still in its early stage where the numbers are small. We initially tested on 33 countries in Europe and obtained r2=0.984 and RMSE rate=3.8%. Outside of Europe, we tested on 152 countries and obtained r2=0.825, RMSE rate=5.9%. The following figures show sample results for Switzerland and Thailand.
Hospital patient allocation optimisation use case
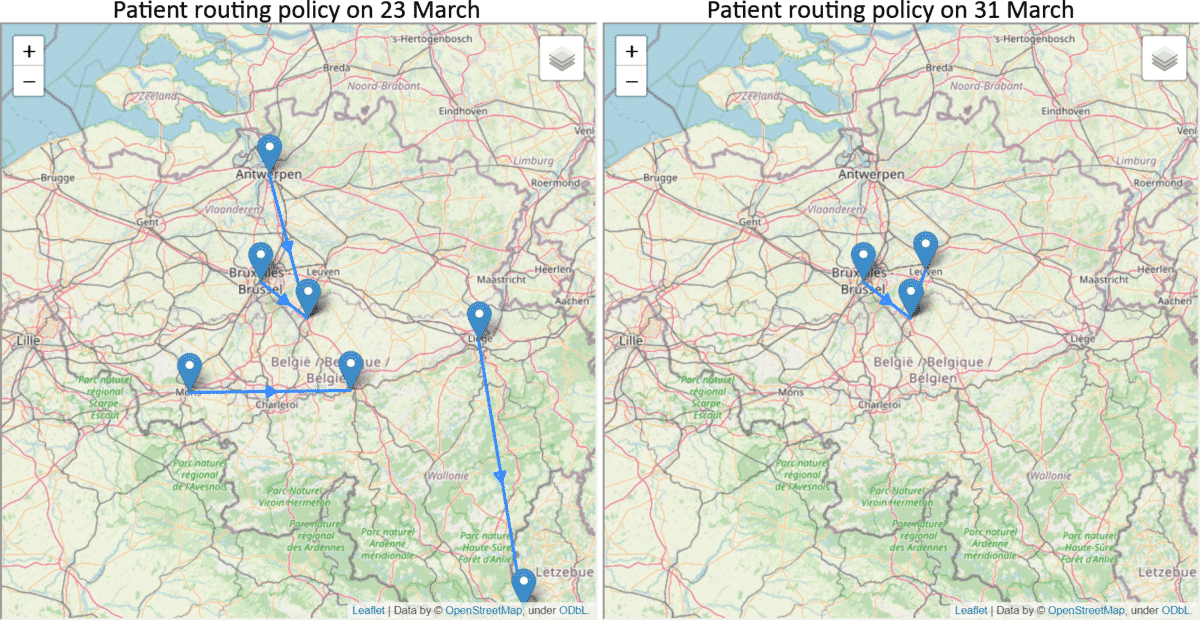
The overloading of ICU units is a major factor on increasing the mortality rate for COVID-19 patients [5]. In collaboration with Gianmaria Leo and Hanadi Wali of the Decision Optimisation team at IBM, we have applied our predictions to tackle a hospital resource optimisation problem. Using the predicted ICU bed occupancy of each region in Belgium, our goal is to assign the patients into hospitals in an optimal way such that all hospitals maintain a similar level of occupancy and avoid getting overloaded in a particular hospital. The following example shows how the patients should be routed on 23 and 31 March, respectively. On 23 March, it was predicted that there will be more increase in the number of ICU patients and more routing was suggested while on 31 March, the decrease in prediction reduced the routing requirement. By increasing the cost of travel, the team also computed different scenarios where sustainability should be prioritised.
Conclusion
This preliminary work is aimed at predicting the number of infections and ICU beds required related to COVID-19. By using a model that does not require domain-specific knowledge, it is flexible to be used in other types of data such as fatality cases but also has a limitation on making longer-term forecasts. We found that usually up to 7 days is reasonably accurate, while the uncertainty increases greatly afterwards. As we accumulate more knowledge about the disease, we can obtain accurate parameters for epidemiological models which can then be fused into the filtering framework. Furthermore, if individual-level interaction and mobility data becomes available, we will be able to predict with higher accuracy.
References
[1] Laporte, R. E. “How to improve monitoring and forecasting of disease patterns,” BMJ: British Medical Journal, 307 (6919), 1573-1574 (1993).
[2] Zhang, Y. “Influenza Trend Prediction Using Kalman Filter and Particle Filter,” Ph.D. Thesis, Department of Physics, Carnegie Mellon University (2016).
[3] Li, Ruiyun, et al. “Substantial undocumented infection facilitates the rapid dissemination of novel coronavirus (SARS-CoV-2).” Science 368.6490 (2020): 489-493.
[4] Yang, Qihui, et al. “Short-term forecasts and long-term mitigation evaluations for the COVID-19 epidemic in Hubei Province, China,” medRxiv (2020).
[5] https://hbr.org/2020/06/we-need-to-relocate-icu-patients-out-of-covid-19-hotspots, Harvard Business Review (2020).
Data sources
[D1] Quoilin, S., Leroy M., Dupont Y. Epistat, Covid19, Sciensano, Brussels, Belgium, https://epistat.wiv-isp.be/covid/
[D2] Download the daily number of new reported cases of COVID-19 By Country Worldwide. European Centre For Disease Prevention And Control, 2020, https://www.ecdc.europa.eu/en/publications-data/download-todays-data-geographic-distribution-covid-19-cases-worldwide
Disclaimer
This information can be used for educational and research use. Please note that this analysis is made on a subset of available data. The authors do not recommend generalizing the results and draw conclusions for decision-making on these sources only.
Author
Kyuhwa Lee is a Senior Data Scientist at the IBM Data Science Elite Team.
This work has been done in collaboration with Sarah Boufelja, Astrid Walle, and Marius Vileiniškis.
We are a team of data scientists from IBM’s Data Science & AI Elite Team, IBM’s Cloud Pak Acceleration Team, and Rolls-Royce’s R2 Data Labs working on Regional Risk-Pulse Index: forecasting and simulation within Emergent Alliance. Have a look at our challenge statement!