
Motivation:
With the Covid-19 pandemic, we are living in unprecedented and highly uncertain times: if scientists know very well the identity of the silent killer: SARS-COV-2, much else about the pandemic is still maddeningly unclear: what are the health factors that make some people really sick and others not? Are the models too optimistic or too pessimistic? How long does the immunity last? How many people got infected in reality and are the reported number accurate enough so we can infer anything useful about the epidemic’s true nature? Given that we have never faced an event like this before, this makes the situation even more difficult in terms of uncertainty.
In this context, within the Emergent Alliance, the Regional Risk Index Team set the goal to apply Machine Learning and Statistical tools to better understand the Dynamics of the disease and translate this knowledge into a predictive risk assessment tool, so we can engineer an improved understanding of the Systemic Risk throughout the recovery pathway.
One major difficulty, in today’s landscape, is the lack of information about the disease spread and risk level at the local and subnational level. The macro dynamics are definitely important as they show the global trend, but this is just one part of the story: a growing number of areas are reporting more granular transmission patterns which could represent a significant turn in the battle against Covid-19. By leveraging the large scale and heterogenous data sources, we propose a system that predicts the health risk level at the regional granularity, in different EU geographies.
Methodology
We know that different local areas and health systems experience the crisis differently. Not only the number of cases differ substantially from place to place but some areas will be less equipped to deal with the crisis. The risk level being driven by multiple and complex factors, our Risk Index should convey as much as possible, this inherent complexity.
Our Regional Risk Index is a composite index that takes into consideration the predicted Infections, in addition to other features representative of the systemic vulnerabilities that pre-existed in the area of interest before the Covid-19 surge. This way, we can account for both Covid-19 specificities, as well as regional characteristics that either support the recovery, or do not provide enough resilience.
Risk Index Formula and Rationale
The current version of the Risk Index is calculated using a Generalized Linear Model (GLM). With this approach, the risk is designed to represent the probability of an adverse event and is processed as a weighted linear combination of the input factors.
The weighted sum is then passed through a Sigmoid link function to ensure the final outputs are between 0 and 1:
Risk Index= f(WiXi ) where f is the Sigmoid function
The weights have been chosen so the prevalence of Covid-19 in the area is amplified by the population density, the pre-existing health issues, the proportion of vulnerable people and the local risk topology, while being counterbalanced by the Country-level Stringency Index [1].
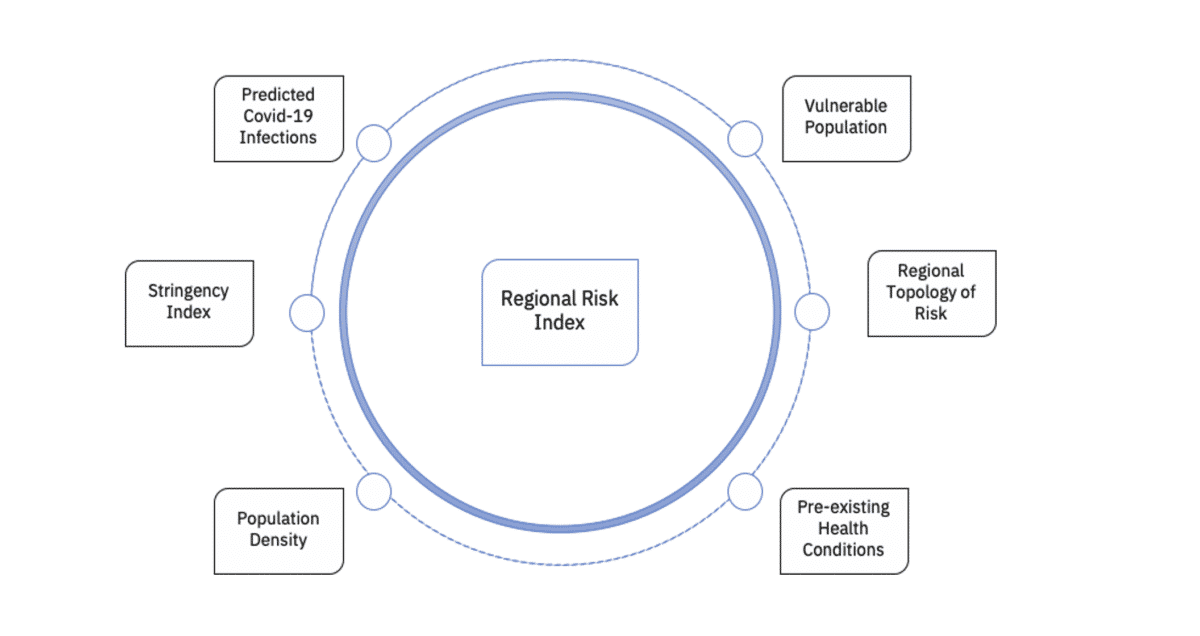
Screenshot describing the different components of the Risk Index
The Risk Index is a relative measure of how critical a region is in a given point in time: if the area is predicted to experience an increase of Covid-19 cases and in addition, has a poor structural resilience, its Risk Index will be higher, compared to another region where either the reported cases are stabilizing or the existing infrastructure is more robust.
Processing pipeline:
All Data sources are openly available. Some initial pre-processing and data cleaning steps were necessary in order to reshape the Data and harmonize the geographical nomenclature. The current scope encompasses the following EU countries: England, France, Italy and Germany and for each of these countries, a granular Risk Index is processed
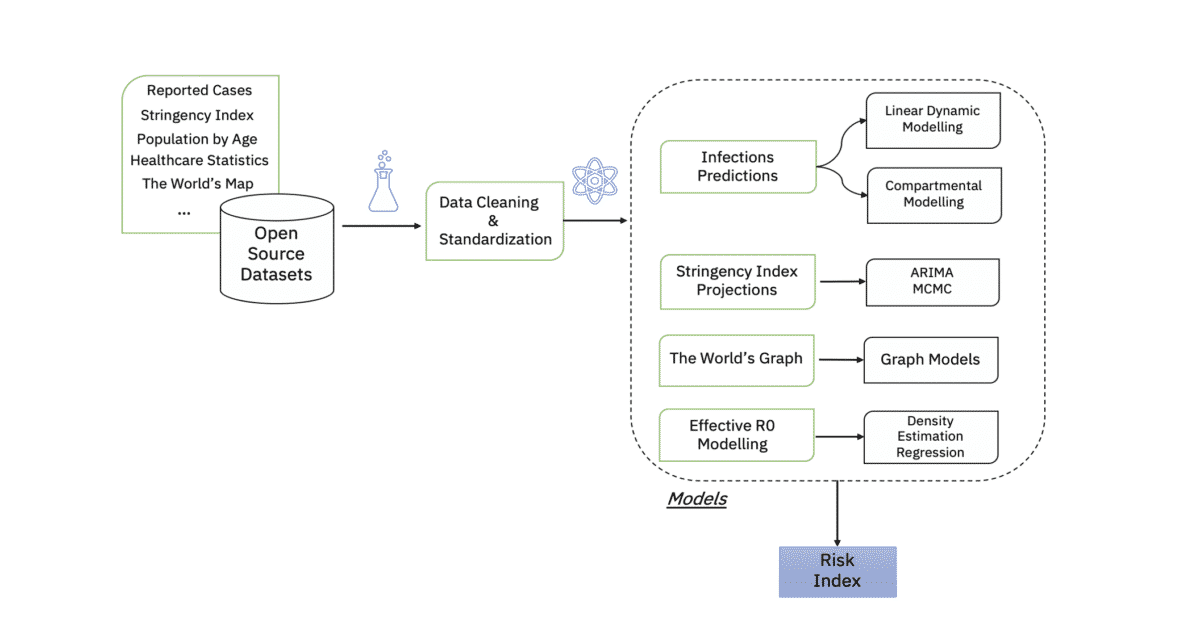
Forecasting Infections:
- One important feature in the composite Risk Index is the forecasted infections. Different modelling strategies have been applied by the team in order to predict these figures.
In general, modelling a disease spread can follow one of two approaches:
- Statistical models: that fit a curve to data and extrapolate from there to predict the future. These models can be used for short-term predictions and yield quantitative projections that policy makers may need for resource allocations [2].
- Mechanistic models: such as (Susceptible-Infected-Recovered) mimic the way the disease spreads in a population and can be used to forecast and simulate future transmission scenarios. Epidemiological models are the only way to explore longer term predictions and by varying the parameters that govern the process of transmission, we can study and analyse different epidemiological outcomes.
Of course, many biological features of Covid-19 transmission remain unknown and this calls for a particular attention in quantifying the models’ uncertainties [2].
For our Risk Index processing, we investigated both statistical and mechanistic approaches:
- The first methodology is based on a Bayesian Filtering approach (Kalman Filter) for the Short-Term predictions. Kalman Filter is extensively used for objects tracking in very noisy and uncertain environments. In our use case, the idea is to model the infections’ dynamics with Newton’s kinematic equations and update the state space (number of infections, growth and acceleration) with Kalman’s equations. A more detailed coverage on that can be found in the following blog: “Covid-19 Short Term Prediction with Kalman Filter”.
- The second approach we implemented is based on Mechanistic (compartmental) models. These models cluster the population into different compartments (S, I, R, etc.) and the movement from one compartment to another is modelled via a set of Ordinary Differential Equations. To account for the complexity and specificity of Covid-19, the basic model can be extended by adding new compartments, such as the Asymptomatic population, which is extremely relevant in the case of Covid-19. Finally, as both aleatory and systemic uncertainties are of major importance, MCMC and Bayesian approaches have been implemented on top of SIR model. Bayesian Machine Learning is a powerful framework that provides a principled way to quantify uncertainty and incorporate prior knowledge into the model [3].
More on that part in the dedicated blog: “Covid-19 Predictions with Bayesian Epidemiological Models”.
- One major parameter in the Covid-19 spread model is the Basic Reproduction Number that indicates the average secondary infections produced by an infected person. This parameter is dimensionless and constant. Since it does not vary over time, this number does not convey the dynamics of the disease transmission.
The Effective Reproduction Number, on the other hand, varies over time and accounts for both susceptible and non-susceptible people. It is a good proxy to measure the disease propagation within a population and is an important parameter in mechanistic models.
The Effective Reproduction Number will be covered in the two following blogs: “Calculation of the effective reproduction number” and “The effective reproduction number, generalization and forecasting”.
Possible Use Cases and Results
There is a wide spectrum of use cases in which the Regional Risk Index can be used:
- For general public usage: this Risk Index can be leveraged by the general public to select appropriate actions while minimizing risk and disruptions to daily life (back to work, travel advice, etc.)
- For Regional Governments and Policy makers: by guiding the policy makers to these specific points with the least structural resilience, we can help them redirect critical Healthcare resources there and in the long run, support their investment decisions.
- The Risk Index can also be of great help for businesses and Supply Chains. By mapping the index to their geographical locations and Supply Chains, businesses can easily identify Covid-19 hotspots and decide to reopen or not. Similarly, the Risk Index gives Supply Chain operators the possibility to optimize their suppliers’ network.
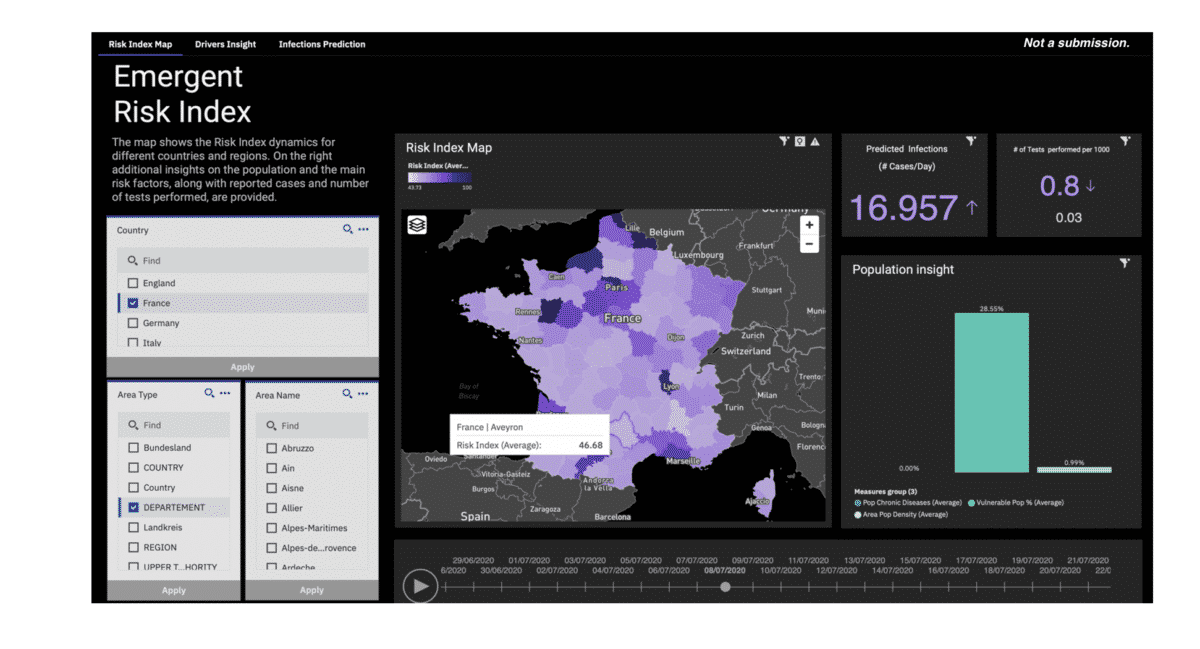
Screenshot of the Risk Index Cognos Dashboard
Final Thoughts and Next Steps:
Multiple areas of improvements have been identified and are already included in our agenda:
- Including new data on Healthcare Capacity and ICU beds. We know that the first wave stretched tremendously the healthcare systems worldwide. A healthcare system with not enough ICU beds and ventilators automatically translates into to higher risk and higher death rates.
- Human behaviour and social interactions are intrinsic components in modelling the Risk: does the population comply with lockdown and social distancing policies? How do people react to Uncertainty and the new restrictions imposed by Governmental and Healthcare institutions? One definitely important improvement will consist in integrating this component into the Risk Index.
- During this first proof-of-concept, data gathering, cleaning and reshaping were a major challenge. Healthcare data in particular is siloed and hard to access. This calls for a Global collaboration to build a reliable and robust repository for Covid-19 Data. Fortunately, many efforts in this direction are already ongoing, but a unique source of truth is still needed, so we can be better armed to manage today’s systemic risks and those yet to come.
To go further:
- “Covid-19 Short Term Prediction with Kalman Filter”
- “Covid-19 Predictions with Bayesian Epidemiological Models”
- “Calculation of the Effective Reproduction Number”
- “The effective reproduction number, generalization and forecasting”
- “Applying geospatial knowledge to the COVID-19 assessments”
Data source:
[1] Thomas Hale, Sam Webster, Anna Petherick, Toby Phillips, and Beatriz Kira. (2020). Oxford COVID-19 Government Response Tracker. Blavatnik School of Government. Link: https://www.bsg.ox.ac.uk/research/research-projects/coronavirus-government-response-tracker
Bibliography:
[2] Inga Holmdahl, S.M., and Caroline Buckee, D.Phil. “Wrong but Useful — What Covid-19 Epidemiologic Models Can and Cannot Tell Us”
[3] “Philosophy of Bayesian Inference”, http://www.cs.toronto.edu/~radford/res-bayes-ex.html
Github repository:
The code of our work can be found in our: GitHub repository.
Disclaimer: This information can be used for educational and research use. Please note that this analysis is made on a subset of available data. The authors do not recommend generalising the results and conclude decision-making on these sources only.
Author
Sarah Boufelja: is a Machine Learning Scientist at the IBM Data Science & AI Elite Team and is a member of the Academy of Technology.
Regional Risk Index Team:
- Astrid Wall, Rolls Royce
- Klaus Paul, Rolls Royce
- Kyuhwa Lee, IBM
- Sarah Boufelja, IBM
We are a team of data scientists from IBM’s Data Science & AI Elite Team, IBM’s Cloud Pak Acceleration Team, and Rolls-Royce’s R2 Data Labs working on Regional Risk-Pulse Index: forecasting and simulation within Emergent Alliance. Have a look at our challenge statement!